QUESTION IMAGE
Question
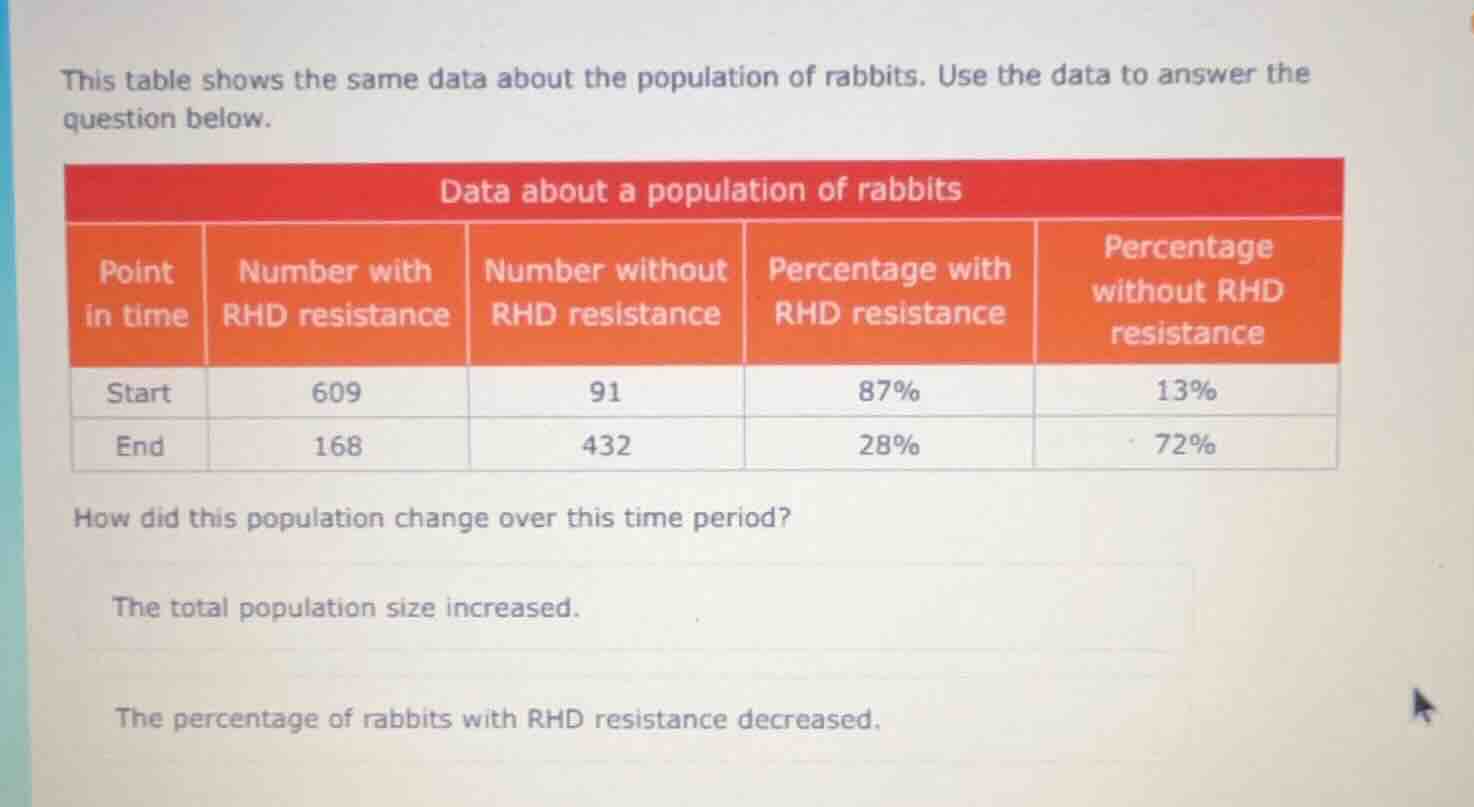
this table shows the same data about the population of rabbits. use the data to answer the question below.
data about a population of rabbits
| point in time | number with rhd resistance | number without rhd resistance | percentage with rhd resistance | percentage without rhd resistance |
|---|---|---|---|---|
| end | 168 | 432 | 28% | 72% |
how did this population change over this time period?
the total population size increased.
the percentage of rabbits with rhd resistance decreased.
Brief Explanations
- Calculate total population at start: sum rabbits with and without RHD resistance.
- Calculate total population at end: sum rabbits with and without RHD resistance.
- Compare total populations and RHD resistance percentages between start and end.

Snap & solve any problem in the app
Get step-by-step solutions on Sovi AI
Photo-based solutions with guided steps
Explore more problems and detailed explanations
- The total population size increased. (Start total: $609 + 91 = 700$; End total: $168 + 432 = 600$ → correction: total population size decreased.
- The percentage of rabbits with RHD resistance decreased. (Start: 87%; End: 28%)
Corrected summary of changes:
The total population size decreased from 700 to 600, and the percentage of rabbits with RHD resistance dropped from 87% to 28%, while the percentage of rabbits without RHD resistance rose from 13% to 72%.