QUESTION IMAGE
Question
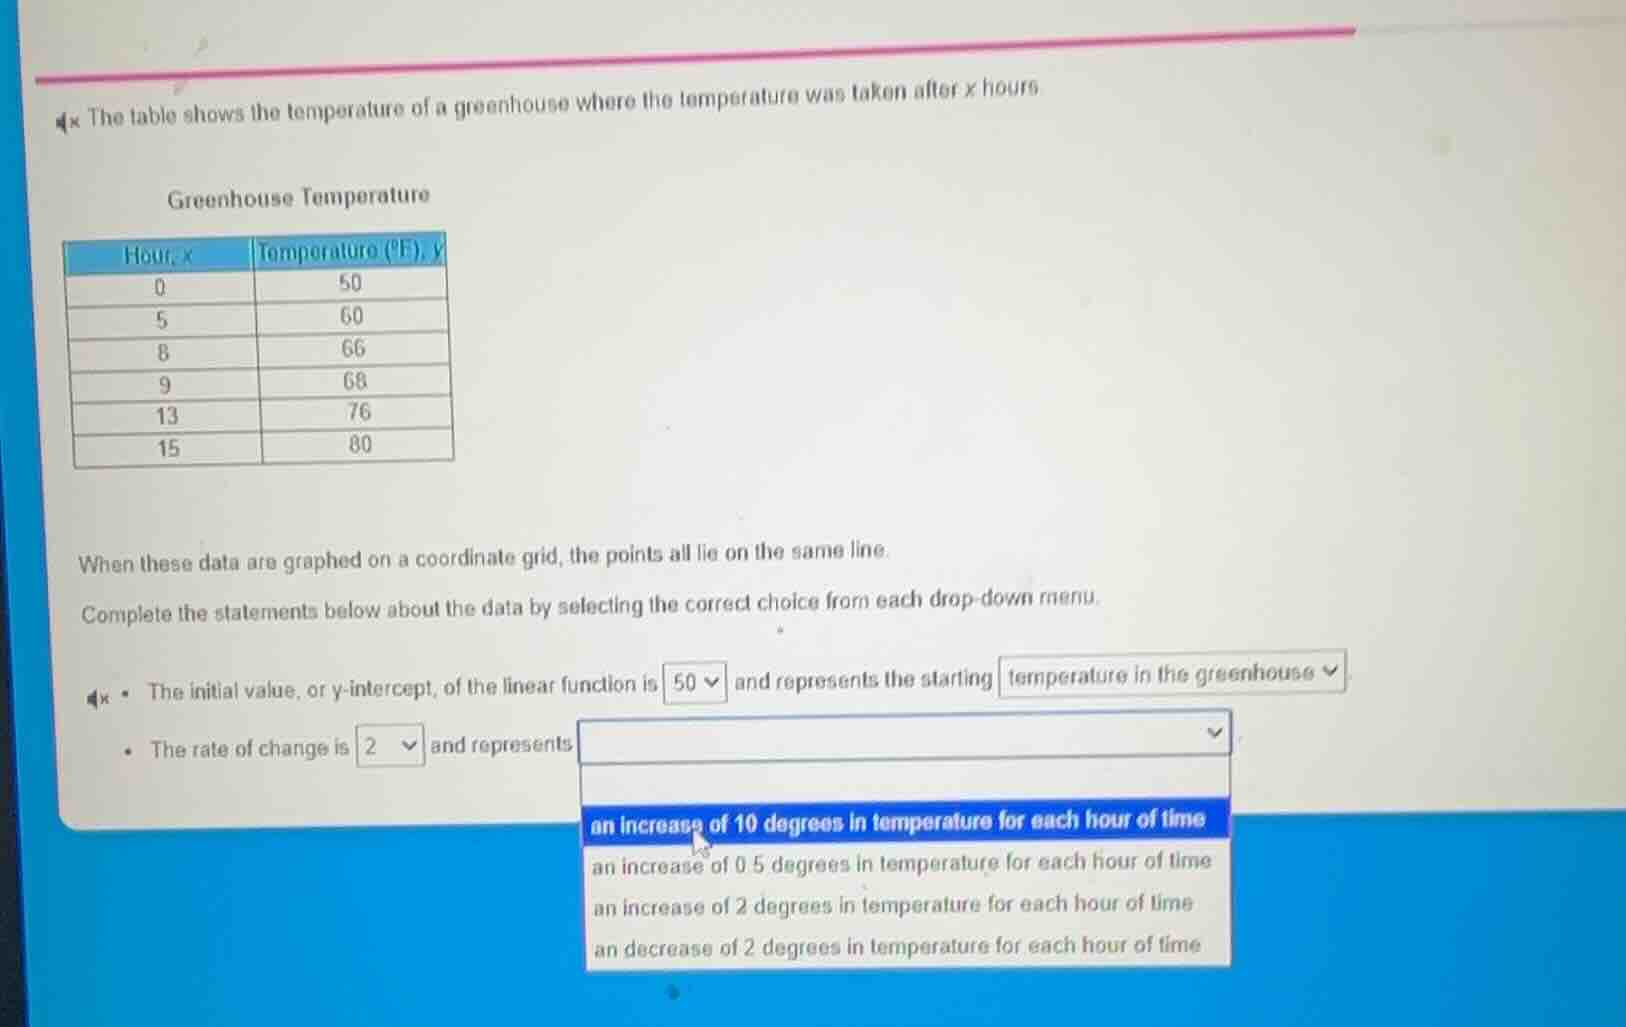
the table shows the temperature of a greenhouse where the temperature was taken after x hours
greenhouse temperature
| hour, x | temperature (°f), y |
|---|---|
| 5 | 60 |
| 8 | 66 |
| 9 | 68 |
| 13 | 76 |
| 15 | 80 |
when these data are graphed on a coordinate grid, the points all lie on the same line.
complete the statements below about the data by selecting the correct choice from each drop - down menu.
- the initial value, or y - intercept, of the linear function is 50 and represents the starting temperature in the greenhouse.
- the rate of change is 2 and represents
options: an increase of 10 degrees in temperature for each hour of time; an increase of 0.5 degrees in temperature for each hour of time; an increase of 2 degrees in temperature for each hour of time; a decrease of 2 degrees in temperature for each hour of time
Step1: Recall rate of change formula
The rate of change (slope) of a linear function is calculated as $\frac{y_2 - y_1}{x_2 - x_1}$. Let's take two points, e.g., $(0, 50)$ and $(5, 60)$.
Step2: Calculate rate of change
Using the formula, $\frac{60 - 50}{5 - 0} = \frac{10}{5} = 2$. So the rate of change is 2, which means for each increase of 1 in $x$ (hour), $y$ (temperature) increases by 2. So it represents an increase of 2 degrees in temperature for each hour of time.

Snap & solve any problem in the app
Get step-by-step solutions on Sovi AI
Photo-based solutions with guided steps
Explore more problems and detailed explanations
an increase of 2 degrees in temperature for each hour of time