QUESTION IMAGE
Question
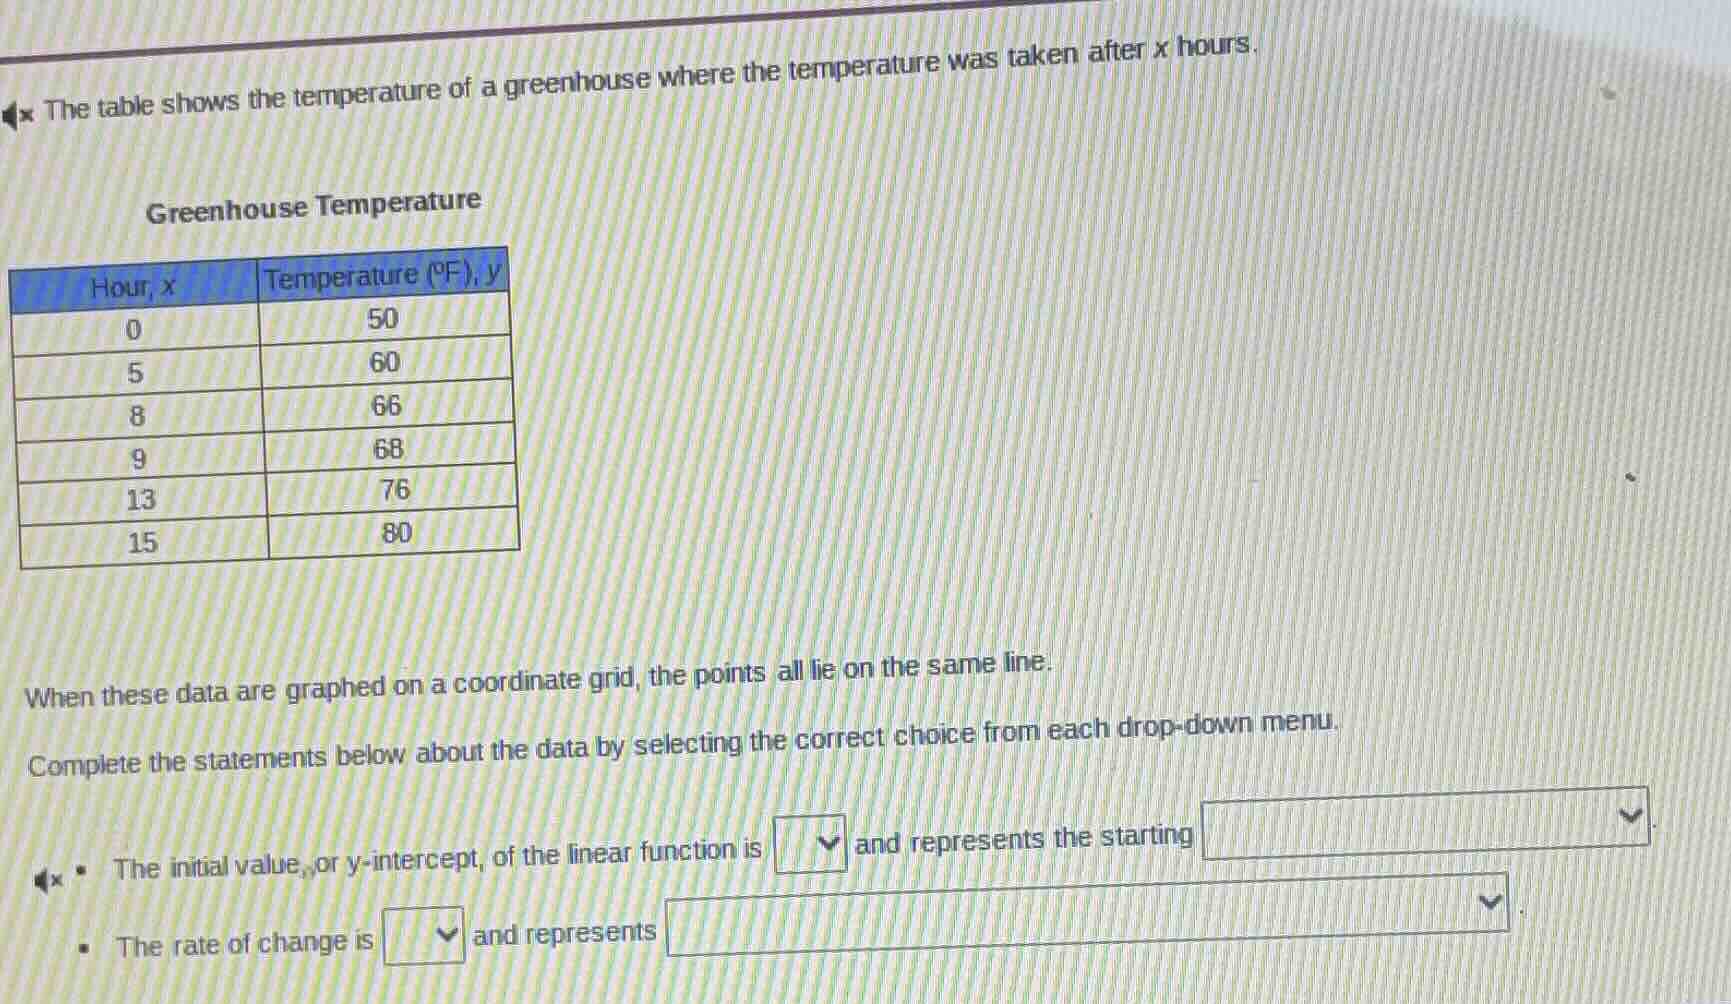
the table shows the temperature of a greenhouse where the temperature was taken after x hours. greenhouse temperature hour, x temperature (°f), y 0 50 5 60 8 66 9 68 13 76 15 80 when these data are graphed on a coordinate grid, the points all lie on the same line. complete the statements below about the data by selecting the correct choice from each drop - down menu. - the initial value, or y - intercept, of the linear function is and represents the starting. - the rate of change is and represents.
Step1: Find the y - intercept
The y - intercept of a linear function \(y = mx + b\) is the value of \(y\) when \(x = 0\). From the table, when \(x = 0\), \(y=50\). So the initial value (y - intercept) is 50, and it represents the starting temperature of the greenhouse (since \(x = 0\) is the starting time, 0 hours).
Step2: Calculate the rate of change (slope)
The rate of change (slope \(m\)) of a linear function is given by the formula \(m=\frac{y_2 - y_1}{x_2 - x_1}\). Let's use the points \((0,50)\) and \((5,60)\). Then \(m=\frac{60 - 50}{5 - 0}=\frac{10}{5}=2\). We can verify with another pair of points, say \((5,60)\) and \((8,66)\). \(m=\frac{66 - 60}{8 - 5}=\frac{6}{3}=2\). So the rate of change is 2, and it represents the change in temperature per hour (since the slope is the change in \(y\) (temperature) per unit change in \(x\) (time in hours)).

Snap & solve any problem in the app
Get step-by-step solutions on Sovi AI
Photo-based solutions with guided steps
Explore more problems and detailed explanations
- The initial value, or y - intercept, of the linear function is \(\boldsymbol{50}\) and represents the starting temperature of the greenhouse.
- The rate of change is \(\boldsymbol{2}\) and represents the increase in temperature per hour.