QUESTION IMAGE
Question
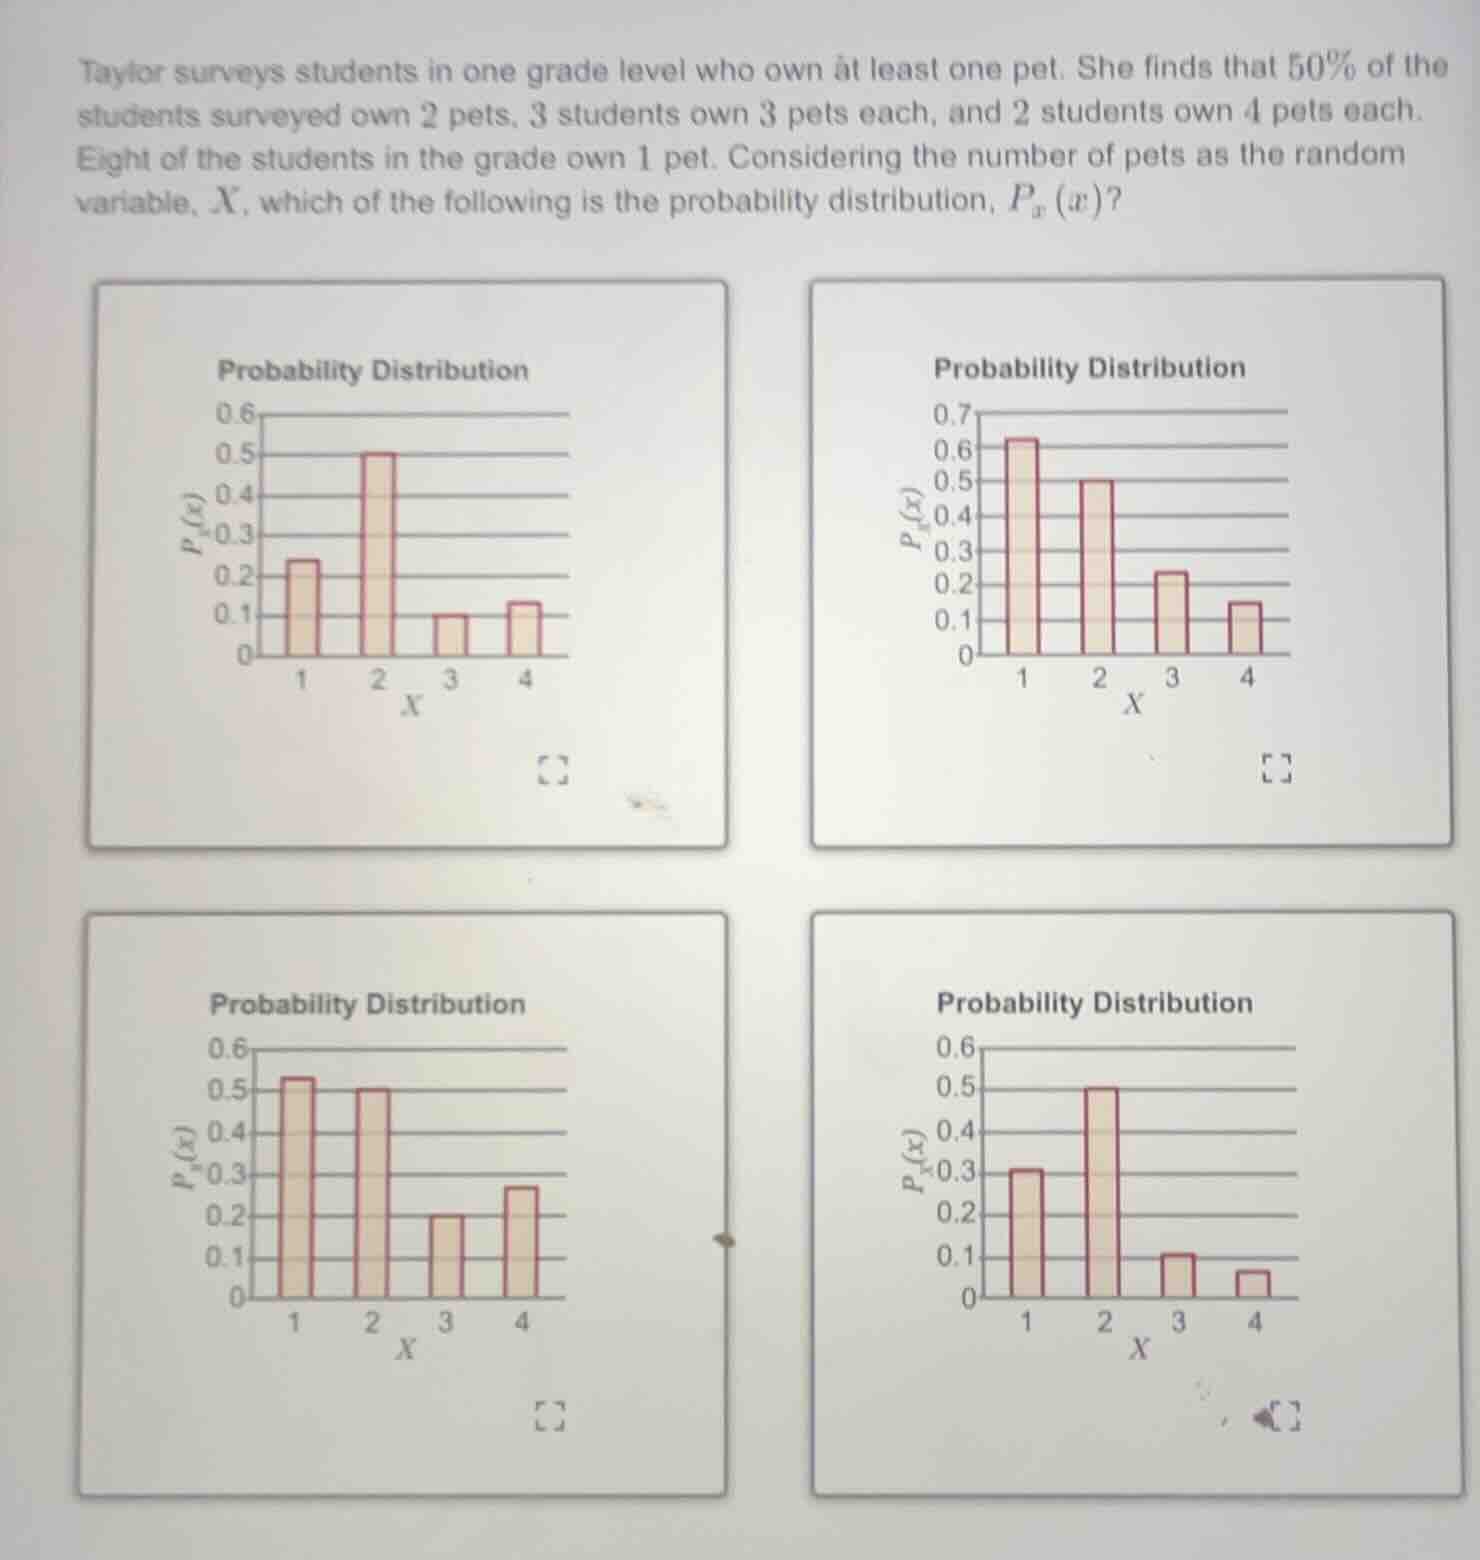
taylor surveys students in one grade level who own at least one pet. she finds that 50% of the students surveyed own 2 pets, 3 students own 3 pets each, and 2 students own 4 pets each. eight of the students in the grade own 1 pet. considering the number of pets as the random variable, x, which of the following is the probability distribution, $p_x(x)$? four probability distribution bar graphs are shown, each with x values 1, 2, 3, 4 and $p_x(x)$ on the y - axis.
Step1: Find total number of students
Let the number of students who own 2 pets be \( n_2 \). We know 50% own 2 pets, 8 own 1 pet, 3 own 3 pets, 2 own 4 pets. Let total students be \( N \). So \( 0.5N = n_2 \), and \( N = 8 + n_2 + 3 + 2 \). Substitute \( n_2 = 0.5N \) into \( N = 8 + 0.5N + 3 + 2 \). Solve: \( N - 0.5N = 13 \) → \( 0.5N = 13 \) → \( N = 26 \). Then \( n_2 = 0.5×26 = 13 \).
Step2: Calculate probabilities
- \( P(X = 1) = \frac{8}{26} \approx 0.3077 \) (≈0.3)
- \( P(X = 2) = \frac{13}{26} = 0.5 \)
- \( P(X = 3) = \frac{3}{26} \approx 0.115 \) (≈0.1)
- \( P(X = 4) = \frac{2}{26} \approx 0.077 \) (≈0.1, closer to 0.1)
Now check the graphs. The fourth graph (bottom right) has \( P(1)\approx0.3 \), \( P(2)=0.5 \), \( P(3)\approx0.1 \), \( P(4)\approx0.1 \) (or smaller but matches the proportions). Wait, wait, re - check: Wait, 8/26≈0.307 (≈0.3), 13/26 = 0.5, 3/26≈0.115 (≈0.1), 2/26≈0.077 (≈0.1). So the first graph? Wait no, the fourth graph (the last one) has for X = 1: ~0.3, X = 2: 0.5, X = 3: ~0.1, X = 4: ~0.1 (smaller). Wait the first graph: X=1: ~0.25, X=2: 0.5, X=3: ~0.1, X=4: ~0.15. Wait my calculation: 8/26≈0.307, 13/26 = 0.5, 3/26≈0.115, 2/26≈0.077. So the fourth graph (the one with X=1: ~0.3, X=2: 0.5, X=3: ~0.1, X=4: ~0.1) matches. Wait the problem's graphs: let's re - express. The bottom right graph (fourth) has:
- X=1: height ~0.3
- X=2: height 0.5
- X=3: height ~0.1
- X=4: height ~0.1 (smaller)
Which matches our probabilities (8/26≈0.3, 13/26 = 0.5, 3/26≈0.1, 2/26≈0.08). So the correct graph is the fourth one (the bottom right probability distribution graph).

Snap & solve any problem in the app
Get step-by-step solutions on Sovi AI
Photo-based solutions with guided steps
Explore more problems and detailed explanations
The bottom - right probability distribution graph (the fourth one)