QUESTION IMAGE
Question
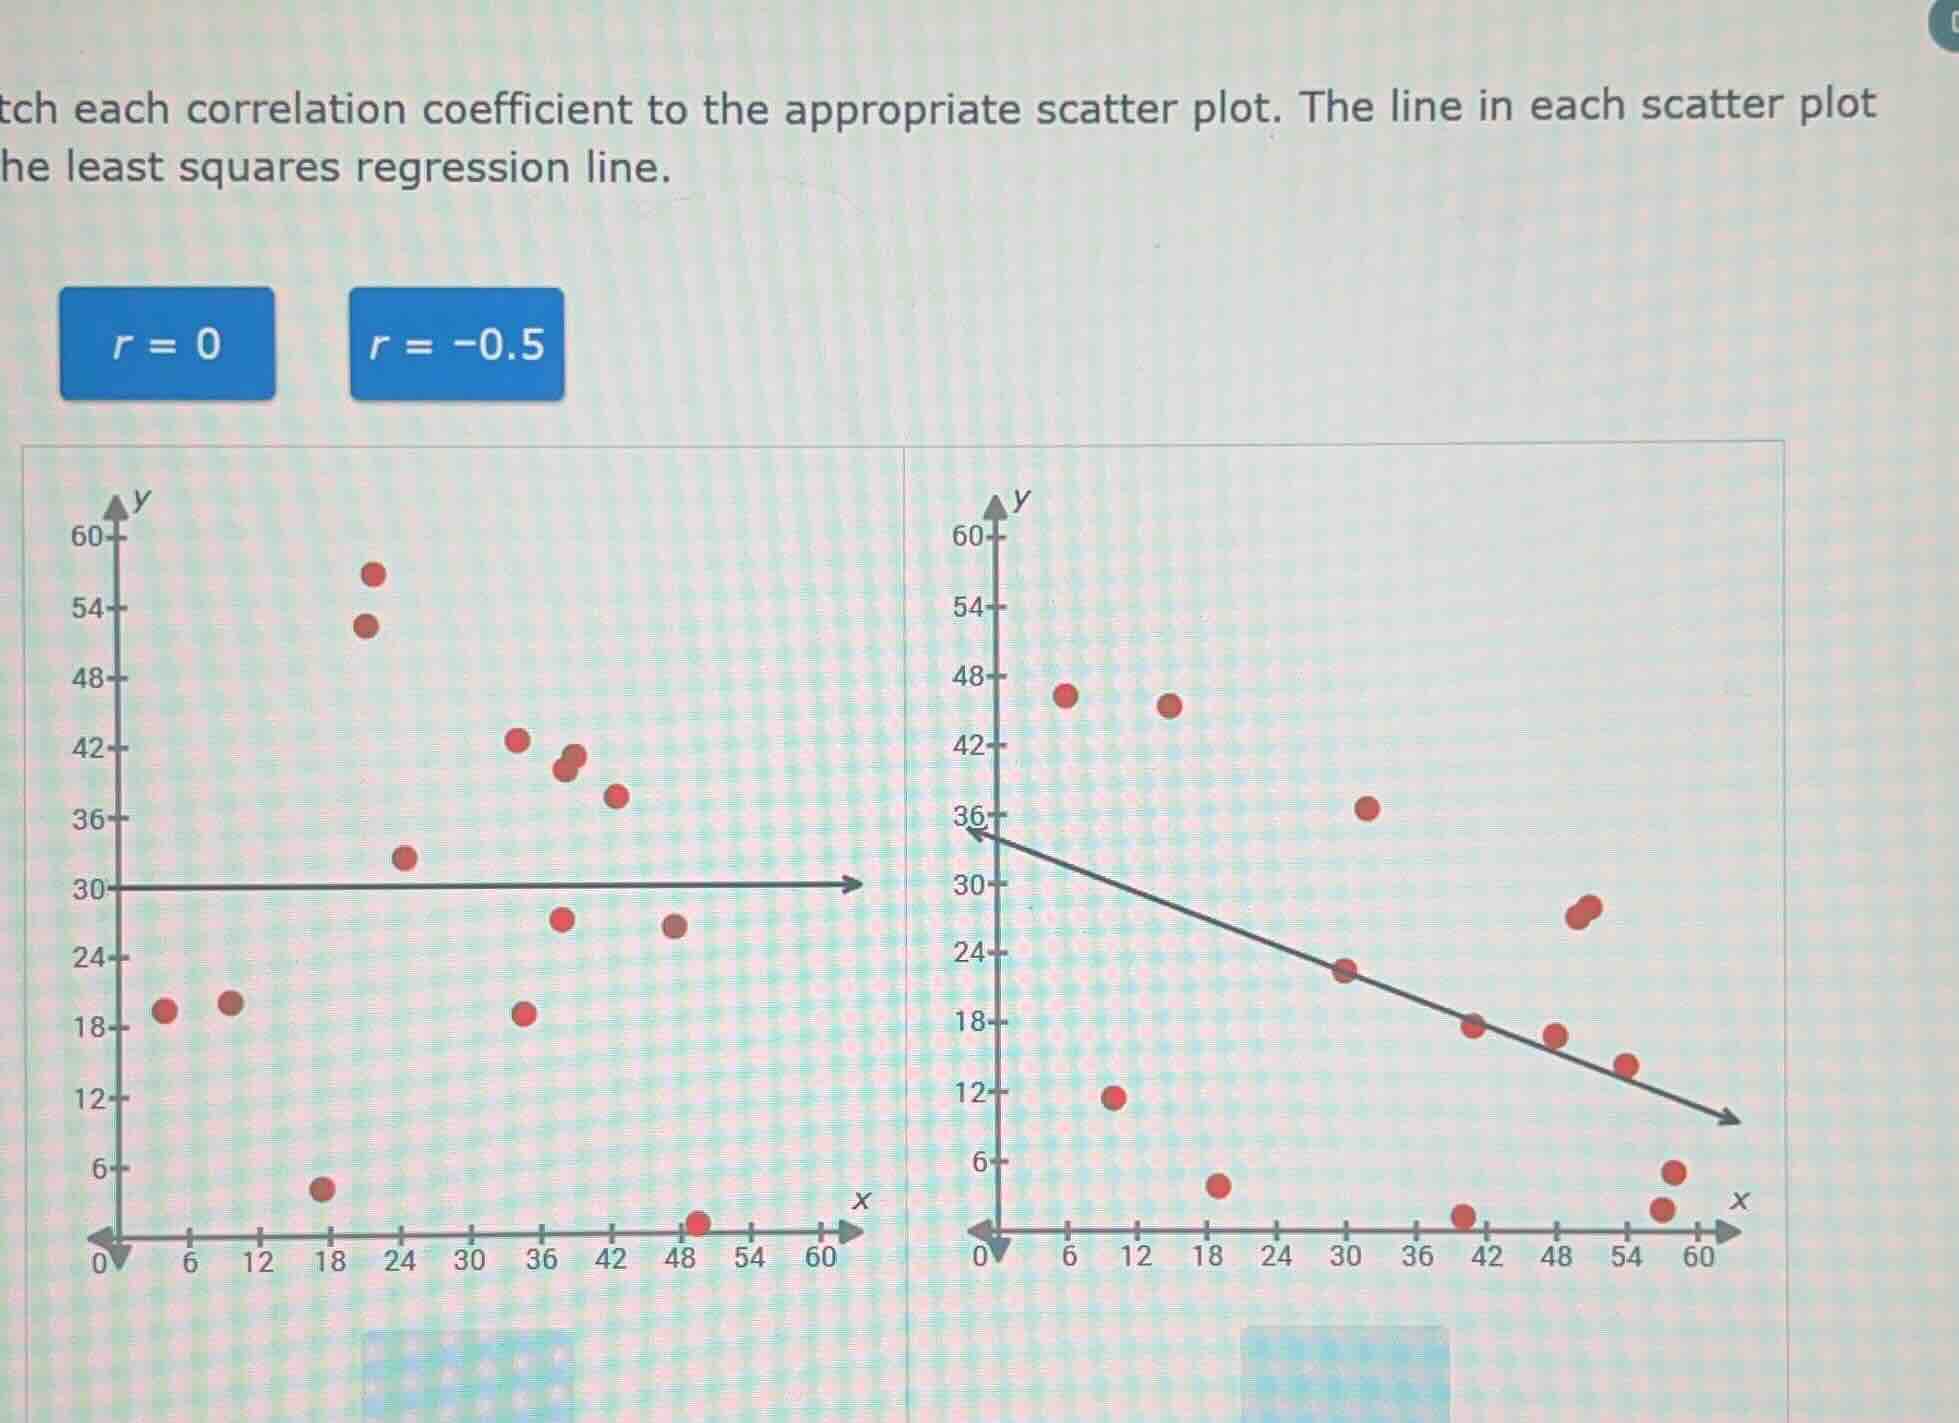
tch each correlation coefficient to the appropriate scatter plot. the line in each scatter plot he least squares regression line.
r = 0
r = -0.5
Brief Explanations
- For the left scatter plot: The horizontal regression line shows no linear trend, and points are randomly scattered with no consistent upward/downward pattern, matching a correlation coefficient of 0.
- For the right scatter plot: The downward-sloping regression line and the general trend of points decreasing as x increases indicate a negative linear relationship, matching a correlation coefficient of -0.5.

Snap & solve any problem in the app
Get step-by-step solutions on Sovi AI
Photo-based solutions with guided steps
Explore more problems and detailed explanations
- Left scatter plot: $r=0$
- Right scatter plot: $r=-0.5$