QUESTION IMAGE
Question
- tell whether each of the following graphs is a function and explain your reasoning.
a. graph a
b. graph b
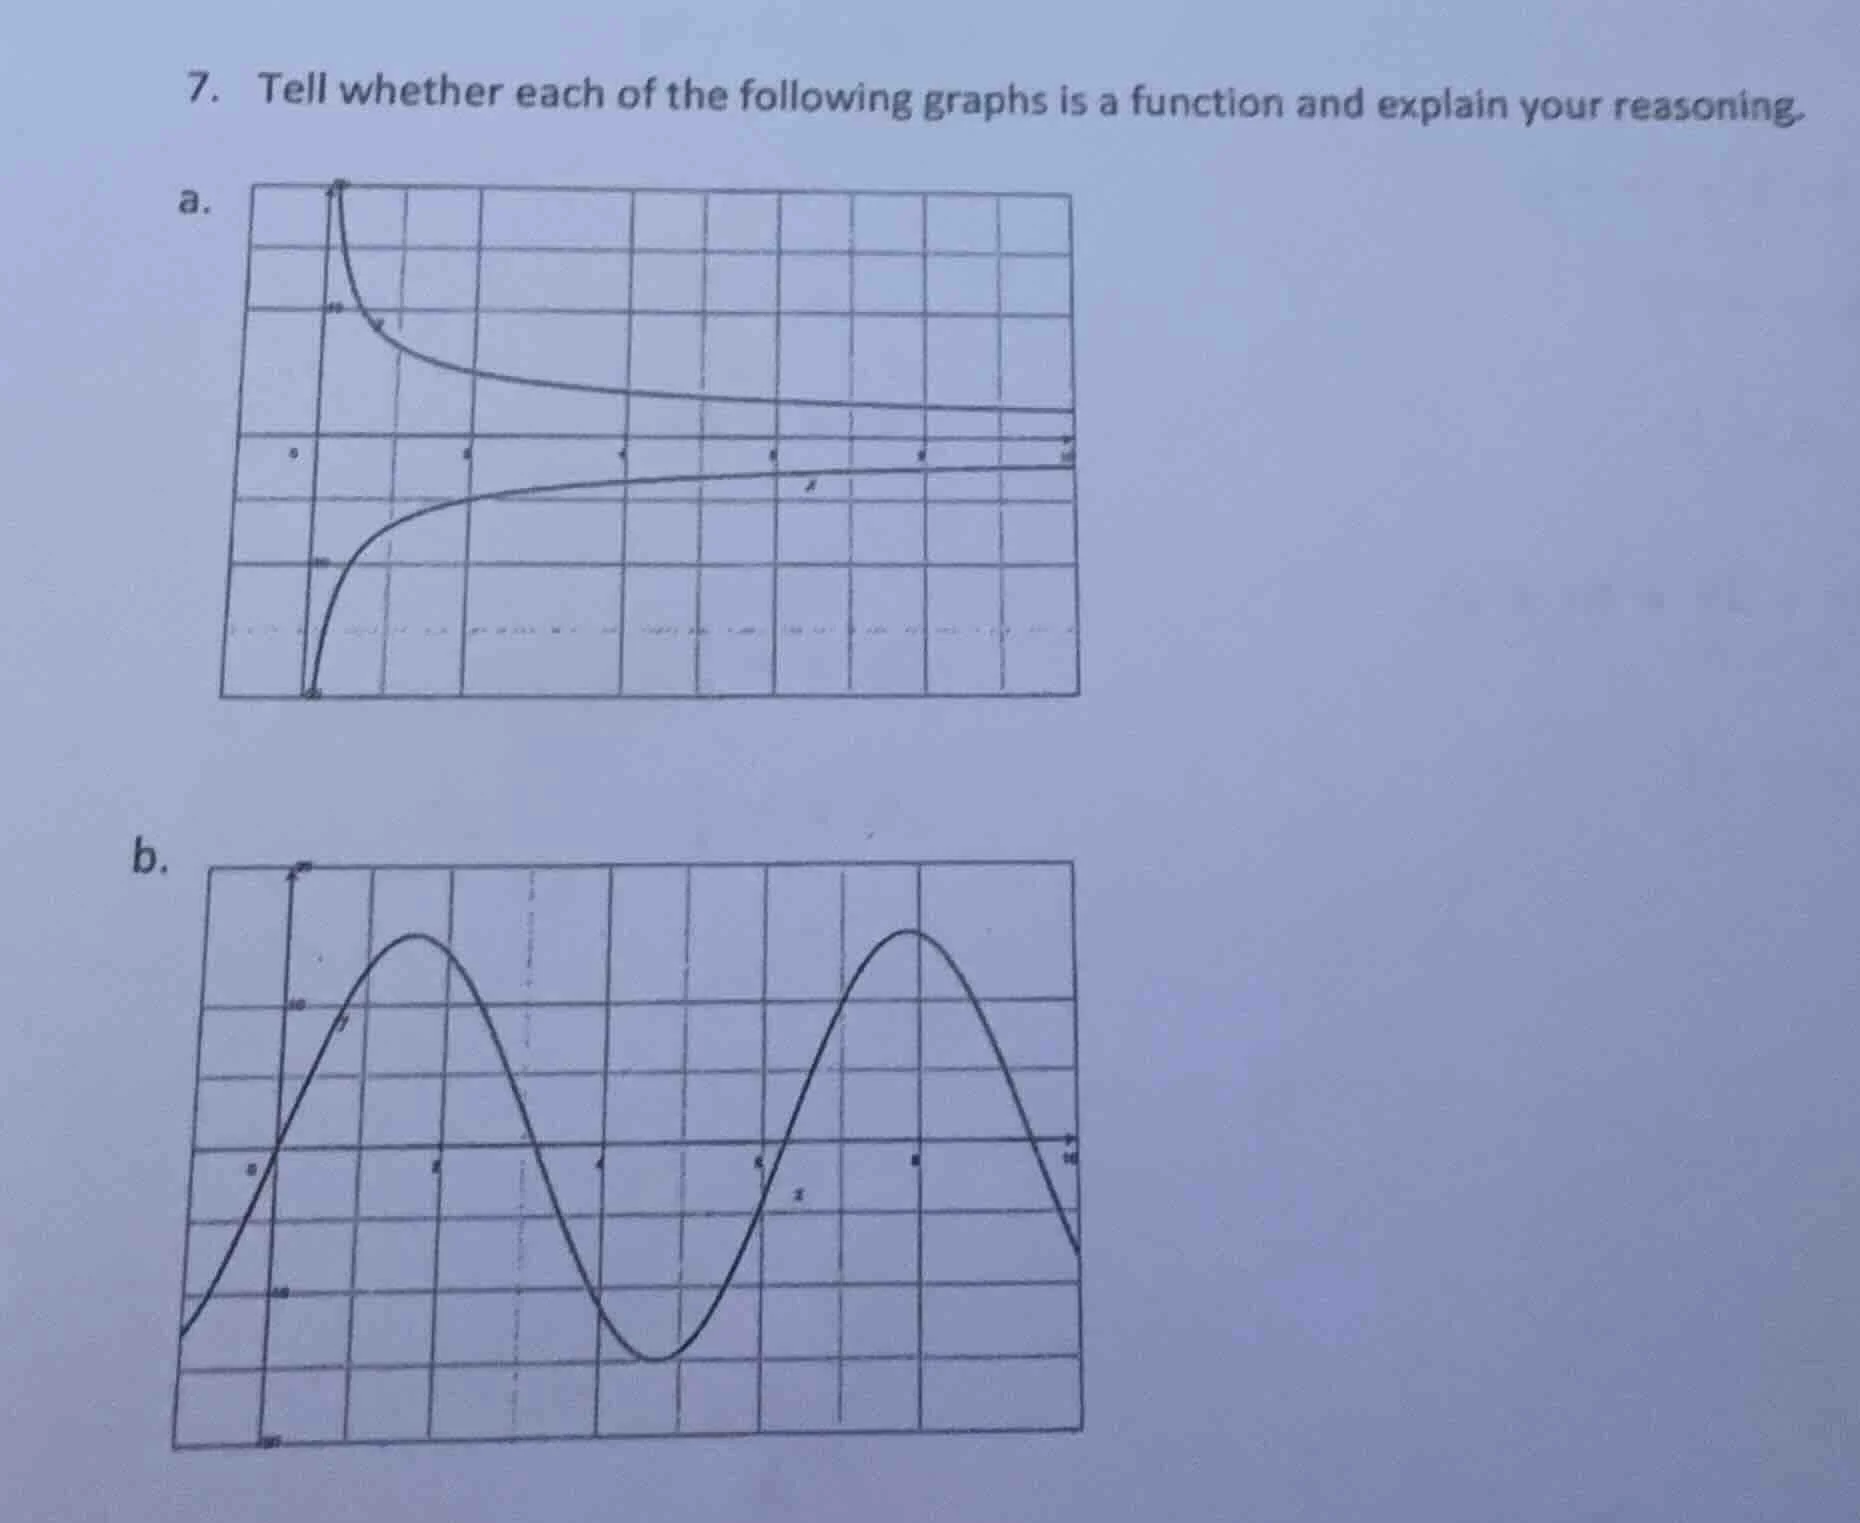
For graph a: Use the Vertical Line Test—any vertical line drawn on the graph intersects the curve at more than one point. A function requires each input (x-value) to have exactly one output (y-value), so this fails the test.
For graph b: Use the Vertical Line Test—every vertical line drawn on the graph intersects the curve at exactly one point. This satisfies the definition of a function, where each x-value has only one corresponding y-value.

Snap & solve any problem in the app
Get step-by-step solutions on Sovi AI
Photo-based solutions with guided steps
Explore more problems and detailed explanations
a. This graph is NOT a function. It fails the Vertical Line Test, as some x-values correspond to multiple y-values.
b. This graph IS a function. It passes the Vertical Line Test, as every x-value has exactly one corresponding y-value.