QUESTION IMAGE
Question
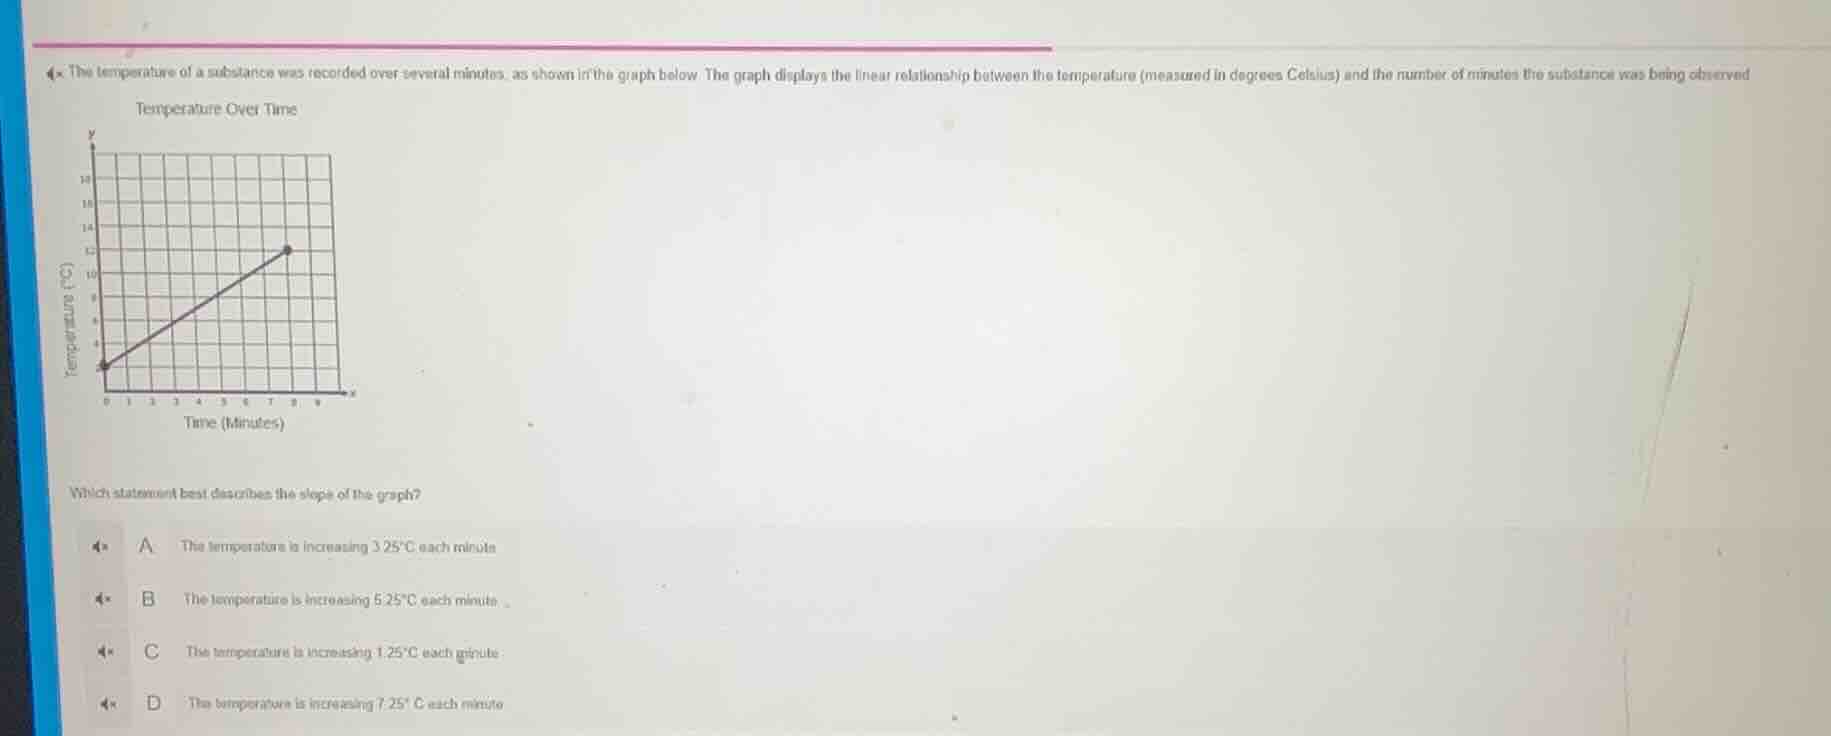
- the temperature of a substance was recorded over several minutes, as shown in the graph below. the graph displays the linear relationship between the temperature (measured in degrees celsius) and the number of minutes the substance was being observed. temperature over time time (minutes) which statement best describes the slope of the graph? a the temperature is increasing 3.25°c each minute b the temperature is increasing 5.25°c each minute c the temperature is increasing 1.25°c each minute d the temperature is increasing 7.25°c each minute
Step1: Identify two points on the line
From the graph, when \( x = 0 \) (time = 0 minutes), \( y = 2 \) (temperature = \( 2^\circ \text{C} \)). When \( x = 8 \) (time = 8 minutes), \( y = 12 \) (temperature = \( 12^\circ \text{C} \)).
Step2: Calculate the slope
The formula for slope \( m \) is \( m=\frac{y_2 - y_1}{x_2 - x_1} \). Substituting the points \( (0, 2) \) and \( (8, 12) \):
\[
m=\frac{12 - 2}{8 - 0}=\frac{10}{8}=1.25
\]
The slope represents the rate of change of temperature with respect to time, so the temperature is increasing \( 1.25^\circ \text{C} \) each minute.

Snap & solve any problem in the app
Get step-by-step solutions on Sovi AI
Photo-based solutions with guided steps
Explore more problems and detailed explanations
C. The temperature is increasing \( 1.25^\circ \text{C} \) each minute