QUESTION IMAGE
Question
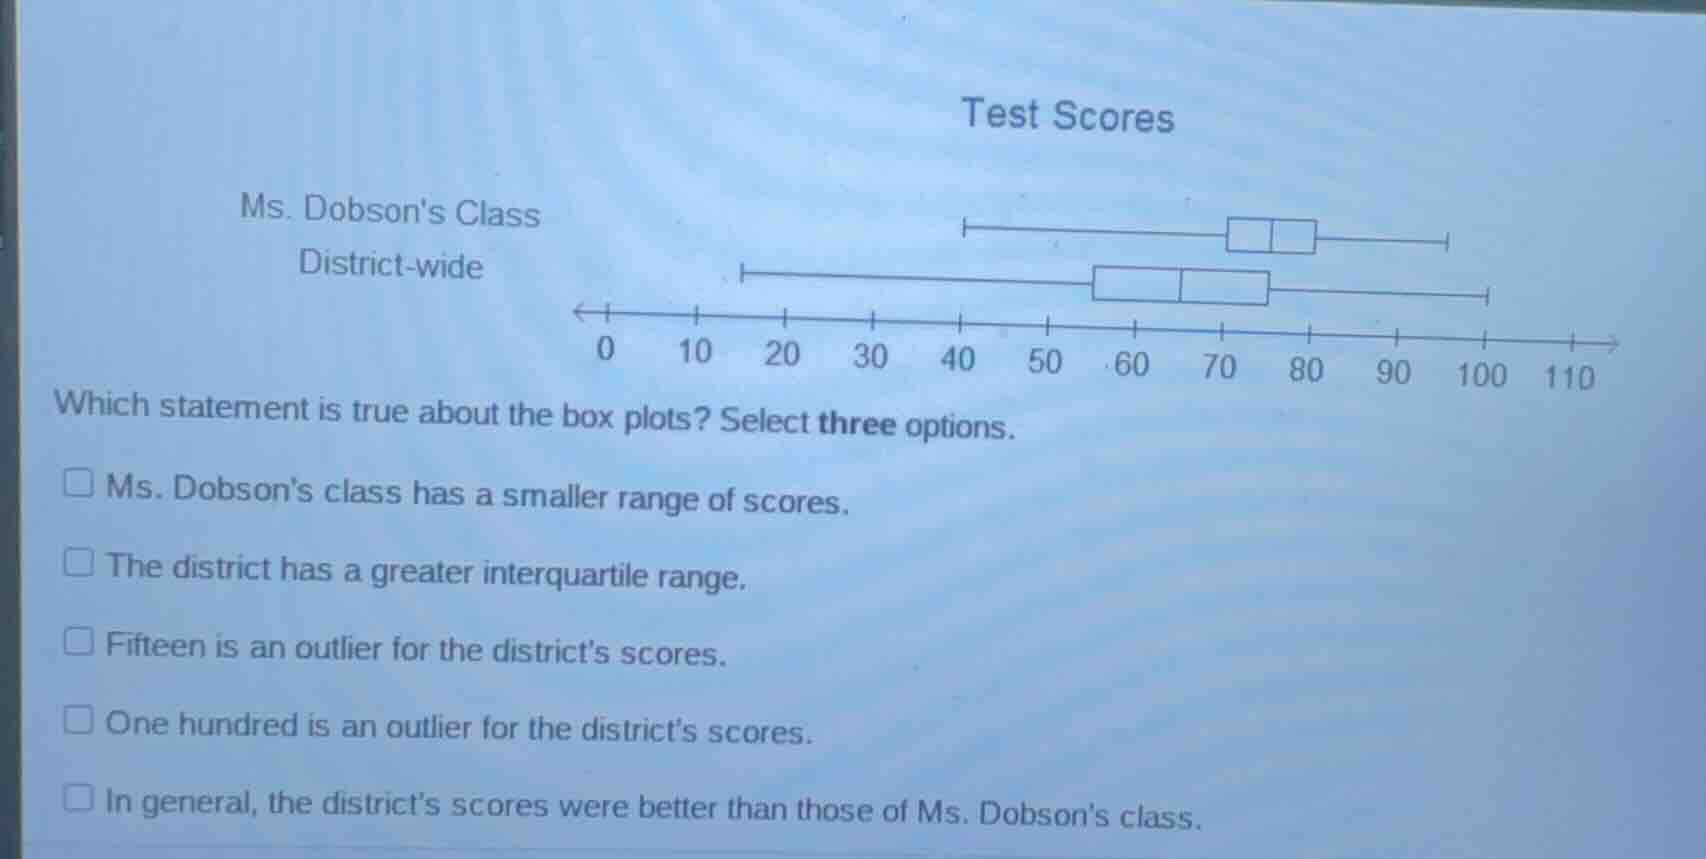
test scores
ms. dobsons class
district - wide
0 10 20 30 40 50 60 70 80 90 100 110
which statement is true about the box plots? select three options.
□ ms. dobsons class has a smaller range of scores.
□ the district has a greater interquartile range.
□ fifteen is an outlier for the districts scores.
□ one hundred is an outlier for the districts scores.
□ in general, the districts scores were better than those of ms. dobsons class.
Step1: Calculate class range
Range = Max - Min = $95 - 45 = 50$
Step2: Calculate district range
Range = Max - Min = $100 - 15 = 85$
Step3: Calculate class IQR
IQR = Q3 - Q1 = $80 - 70 = 10$
Step4: Calculate district IQR
IQR = Q3 - Q1 = $80 - 60 = 20$
Step5: Check district outliers
Lower fence: $Q1 - 1.5\times IQR = 60 - 1.5\times20 = 30$; Upper fence: $Q3 + 1.5\times IQR = 80 + 1.5\times20 = 110$
Step6: Compare median scores
Class median = $75$, District median = $70$

Snap & solve any problem in the app
Get step-by-step solutions on Sovi AI
Photo-based solutions with guided steps
Explore more problems and detailed explanations
A. Ms. Dobson's class has a smaller range of scores.
B. The district has a greater interquartile range.
C. Fifteen is an outlier for the district's scores.