QUESTION IMAGE
Question
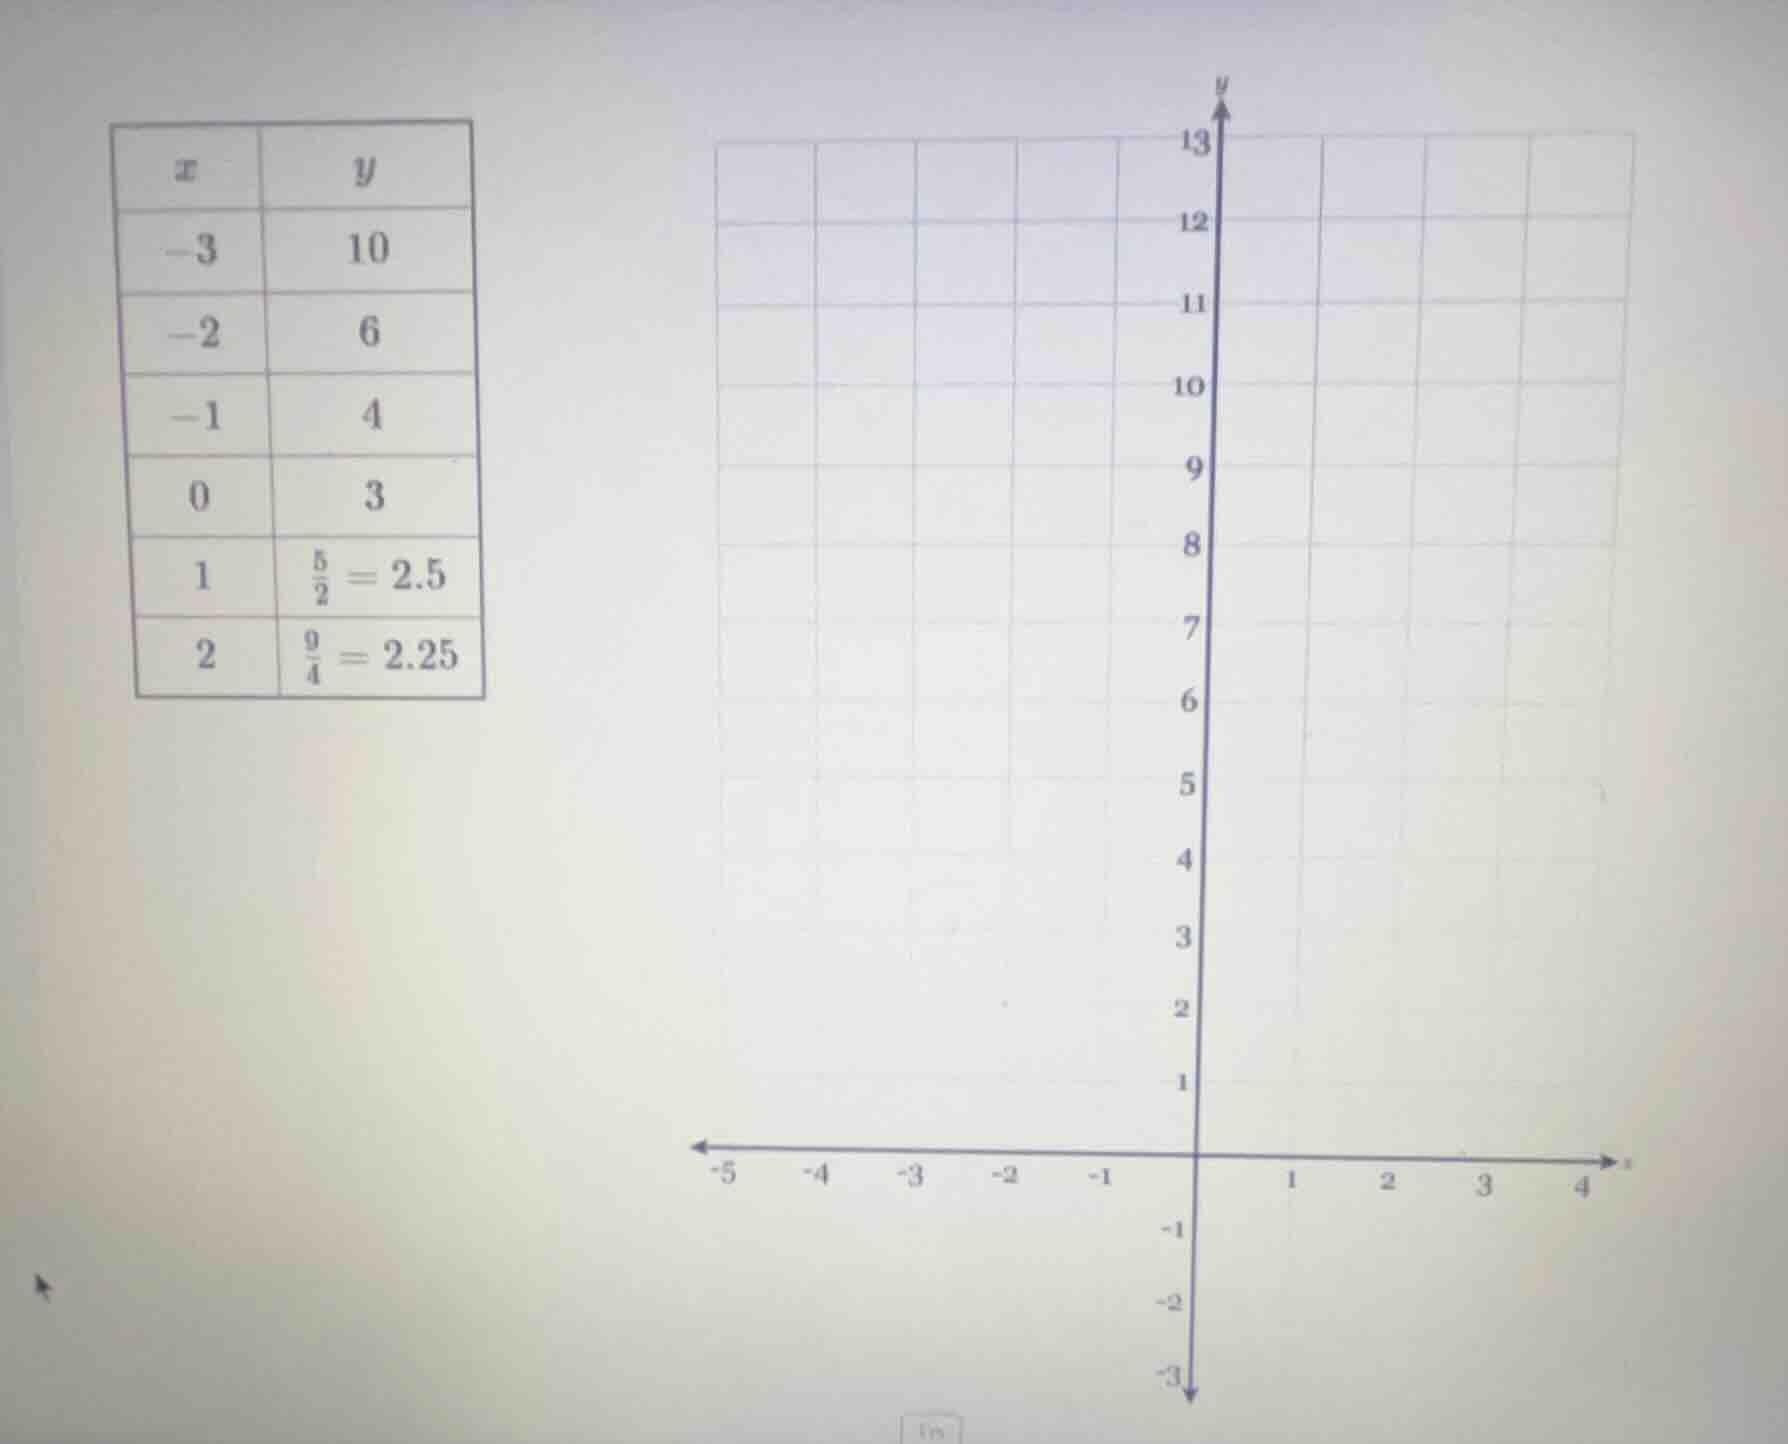
there is a table of x and y values: when x is -3, y is 10; x is -2, y is 6; x is -1, y is 4; x is 0, y is 3; x is 1, y is 5/2 = 2.5; x is 2, y is 9/4 = 2.25. and there is a coordinate plane with x - axis from -5 to 4 and y - axis from -3 to 13, with grid lines.
To plot the points from the table on the coordinate plane, we follow these steps:
Step 1: Identify the coordinates
For each row in the table, the first value is the \( x \)-coordinate and the second is the \( y \)-coordinate. So we have the points:
- \( (-3, 10) \)
- \( (-2, 6) \)
- \( (-1, 4) \)
- \( (0, 3) \)
- \( (1, 2.5) \)
- \( (2, 2.25) \)
Step 2: Locate \( x \)-coordinate on the x - axis
For a point \( (x,y) \), first find the position of \( x \) on the horizontal (x - axis). For example, for the point \( (-3,10) \), we find \( x=-3 \) on the x - axis (which is 3 units to the left of the origin).
Step 3: Locate \( y \)-coordinate on the y - axis
From the position of \( x \) on the x - axis, move vertically (up or down) to the level of the \( y \)-coordinate on the vertical (y - axis). For the point \( (-3,10) \), from \( x = - 3\) on the x - axis, move up 10 units (since \( y=10\)) to mark the point.
Step 4: Plot all points
- For \( (-2,6) \): Find \( x=-2 \) on the x - axis, then move up 6 units.
- For \( (-1,4) \): Find \( x = - 1\) on the x - axis, then move up 4 units.
- For \( (0,3) \): The \( x \)-coordinate is 0 (the origin), move up 3 units.
- For \( (1,2.5) \): Find \( x = 1\) on the x - axis (1 unit to the right of the origin), then move up 2.5 units (halfway between 2 and 3).
- For \( (2,2.25) \): Find \( x=2 \) on the x - axis (2 units to the right of the origin), then move up 2.25 units (a quarter of the way between 2 and 3).
After plotting all these points, we get the graph of the relation defined by the table. If we were to draw a smooth curve through these points (since it seems like a function), we would have a curve that starts from the left (at \( x=-3,y = 10\)) and decreases as \( x \) increases, approaching a horizontal asymptote as \( x\to\infty\) (since as \( x \) increases, \( y \) values are getting closer to 2 but not going below a certain value).
If the task was just to plot the points, the plotted points would be at the locations described above. If we consider the general shape, it is a decreasing function (as \( x \) increases, \( y \) decreases) for \( x\geq - 3\).

Snap & solve any problem in the app
Get step-by-step solutions on Sovi AI
Photo-based solutions with guided steps
Explore more problems and detailed explanations
To plot the points from the table on the coordinate plane, we follow these steps:
Step 1: Identify the coordinates
For each row in the table, the first value is the \( x \)-coordinate and the second is the \( y \)-coordinate. So we have the points:
- \( (-3, 10) \)
- \( (-2, 6) \)
- \( (-1, 4) \)
- \( (0, 3) \)
- \( (1, 2.5) \)
- \( (2, 2.25) \)
Step 2: Locate \( x \)-coordinate on the x - axis
For a point \( (x,y) \), first find the position of \( x \) on the horizontal (x - axis). For example, for the point \( (-3,10) \), we find \( x=-3 \) on the x - axis (which is 3 units to the left of the origin).
Step 3: Locate \( y \)-coordinate on the y - axis
From the position of \( x \) on the x - axis, move vertically (up or down) to the level of the \( y \)-coordinate on the vertical (y - axis). For the point \( (-3,10) \), from \( x = - 3\) on the x - axis, move up 10 units (since \( y=10\)) to mark the point.
Step 4: Plot all points
- For \( (-2,6) \): Find \( x=-2 \) on the x - axis, then move up 6 units.
- For \( (-1,4) \): Find \( x = - 1\) on the x - axis, then move up 4 units.
- For \( (0,3) \): The \( x \)-coordinate is 0 (the origin), move up 3 units.
- For \( (1,2.5) \): Find \( x = 1\) on the x - axis (1 unit to the right of the origin), then move up 2.5 units (halfway between 2 and 3).
- For \( (2,2.25) \): Find \( x=2 \) on the x - axis (2 units to the right of the origin), then move up 2.25 units (a quarter of the way between 2 and 3).
After plotting all these points, we get the graph of the relation defined by the table. If we were to draw a smooth curve through these points (since it seems like a function), we would have a curve that starts from the left (at \( x=-3,y = 10\)) and decreases as \( x \) increases, approaching a horizontal asymptote as \( x\to\infty\) (since as \( x \) increases, \( y \) values are getting closer to 2 but not going below a certain value).
If the task was just to plot the points, the plotted points would be at the locations described above. If we consider the general shape, it is a decreasing function (as \( x \) increases, \( y \) decreases) for \( x\geq - 3\).