QUESTION IMAGE
Question
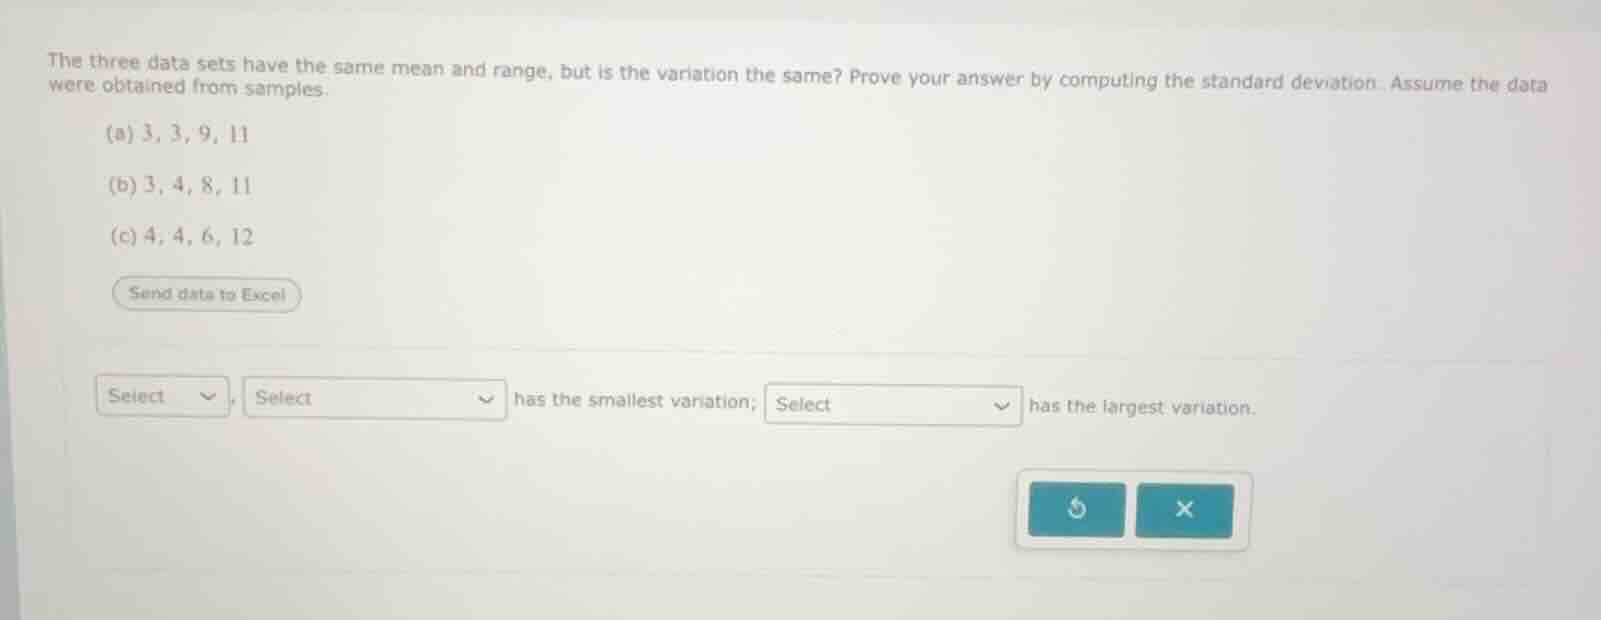
the three data sets have the same mean and range, but is the variation the same? prove your answer by computing the standard deviation. assume the data were obtained from samples.
(a) 3, 3, 9, 11
(b) 3, 4, 8, 11
(c) 4, 4, 6, 12
send data to excel
select, select has the smallest variation; select has the largest variation.
To determine the variation, we calculate the sample standard deviation for each data set. The formula for the sample standard deviation \( s \) is:
\[
s = \sqrt{\frac{\sum (x_i - \bar{x})^2}{n - 1}}
\]
where \( \bar{x} \) is the sample mean, \( x_i \) are the data points, and \( n \) is the sample size.
Step 1: Calculate the mean (\( \bar{x} \)) for each data set
All three data sets have \( n = 4 \) data points. Let's verify the mean:
For (a): \( \bar{x}_a = \frac{3 + 3 + 9 + 11}{4} = \frac{26}{4} = 6.5 \)
For (b): \( \bar{x}_b = \frac{3 + 4 + 8 + 11}{4} = \frac{26}{4} = 6.5 \)
For (c): \( \bar{x}_c = \frac{4 + 4 + 6 + 12}{4} = \frac{26}{4} = 6.5 \)
Step 2: Calculate the sum of squared deviations (\( \sum (x_i - \bar{x})^2 \)) for each data set
Data Set (a): \( 3, 3, 9, 11 \)
\[
\]
Data Set (b): \( 3, 4, 8, 11 \)
\[
\]
Data Set (c): \( 4, 4, 6, 12 \)
\[
\]
Step 3: Calculate the sample standard deviation (\( s \)) for each data set
The sample standard deviation is:
\[
s = \sqrt{\frac{\sum (x_i - \bar{x})^2}{n - 1}}
\]
For (a):
\[
s_a = \sqrt{\frac{51}{4 - 1}} = \sqrt{\frac{51}{3}} \approx \sqrt{17} \approx 4.123
\]
For (b):
\[
s_b = \sqrt{\frac{41}{4 - 1}} = \sqrt{\frac{41}{3}} \approx \sqrt{13.6667} \approx 3.697
\]
For (c):
\[
s_c = \sqrt{\frac{47}{4 - 1}} = \sqrt{\frac{47}{3}} \approx \sqrt{15.6667} \approx 3.958
\]
Step 4: Compare the standard deviations
- \( s_b \approx 3.697 \) (smallest)
- \( s_c \approx 3.958 \)
- \( s_a \approx 4.123 \) (largest)
Thus, data set (b) has the smallest variation, and data set (a) has the largest variation.

Snap & solve any problem in the app
Get step-by-step solutions on Sovi AI
Photo-based solutions with guided steps
Explore more problems and detailed explanations
(b) \( 3, 4, 8, 11 \) has the smallest variation; (a) \( 3, 3, 9, 11 \) has the largest variation.