QUESTION IMAGE
Question
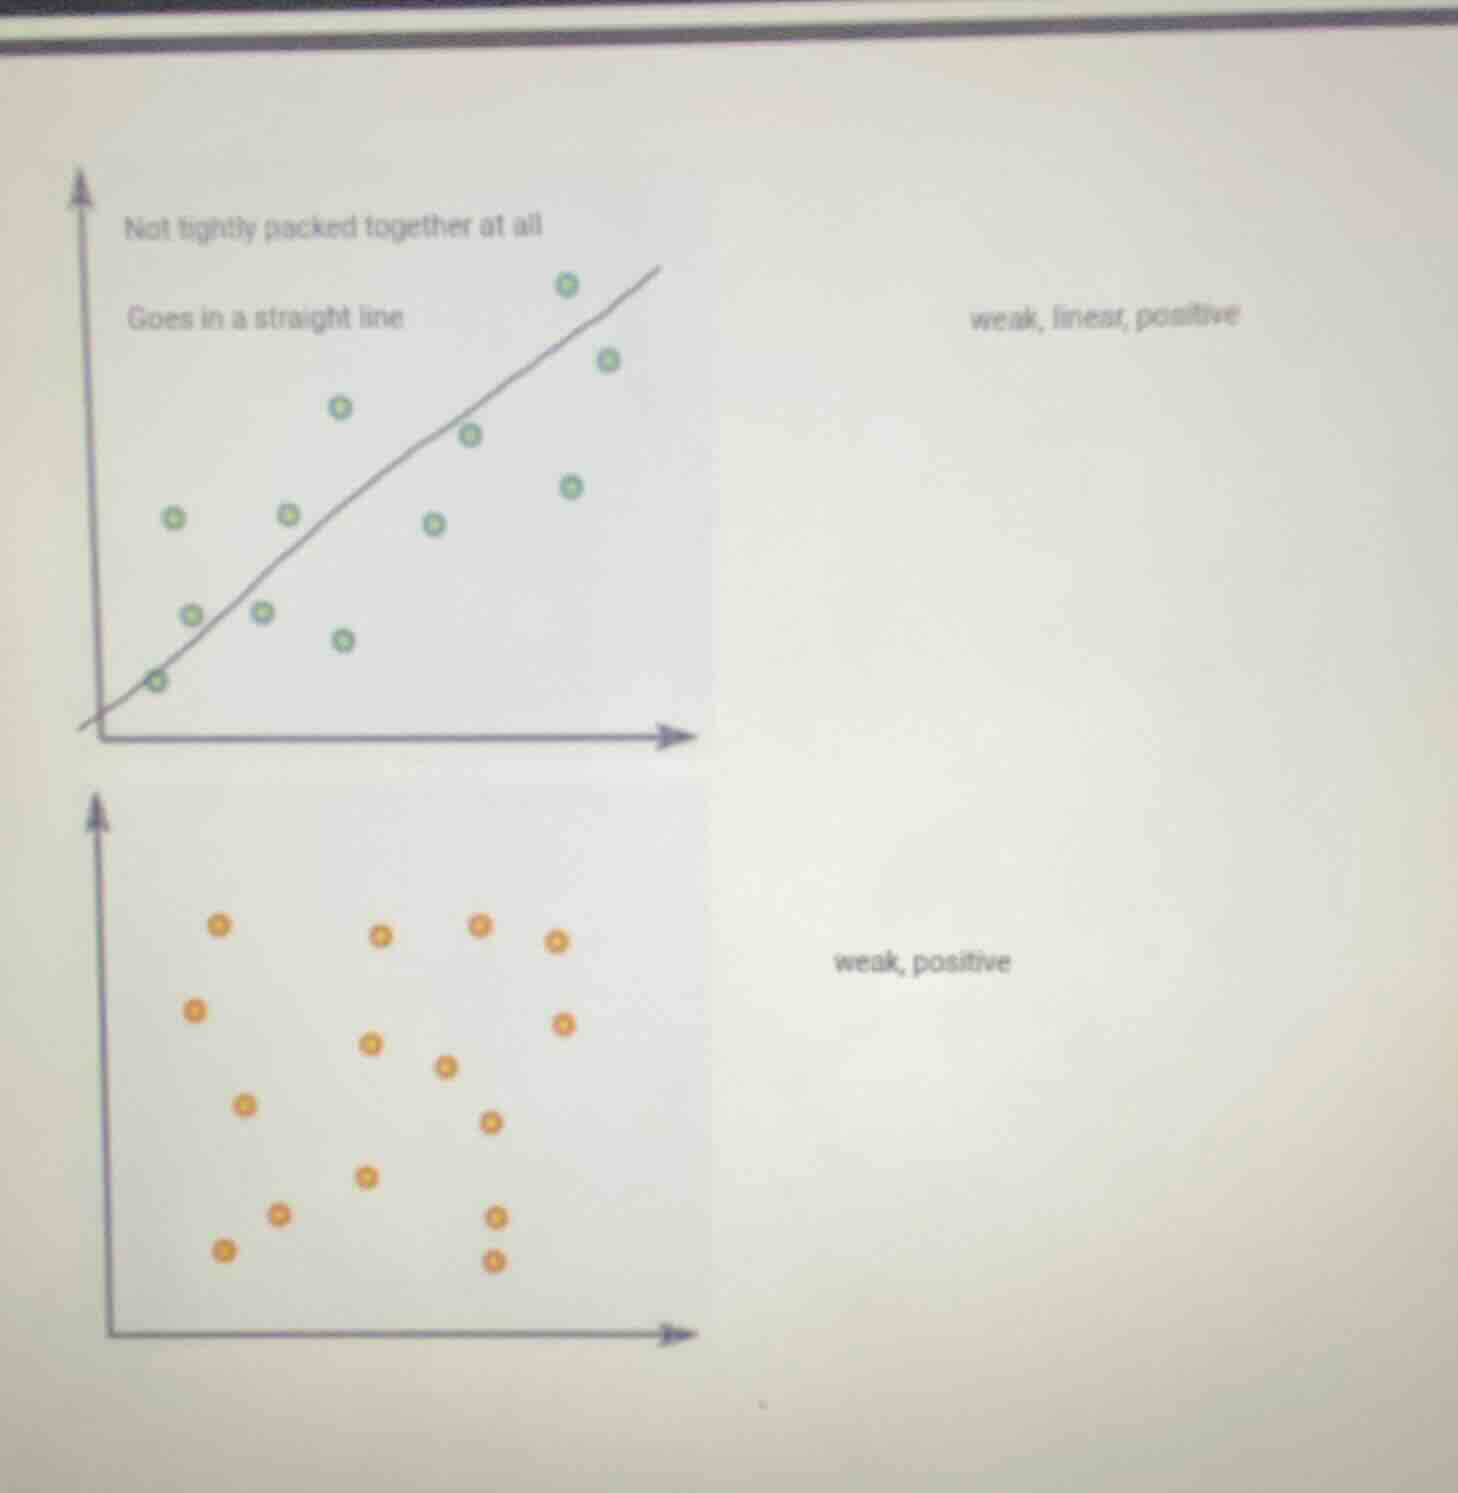
not tightly packed together at all; goes in a straight line; weak, linear, positive; weak, positive
Step1: Analyze the first scatter plot
The first scatter plot has points that show a linear trend (go in a straight line) but are not tightly packed, and the direction is positive (as x increases, y tends to increase). So it's a weak, linear, positive correlation.
Step2: Analyze the second scatter plot
The second scatter plot has points with a positive trend (as x increases, y tends to increase) but no clear linear pattern (no straight - line trend), just a weak positive association.

Snap & solve any problem in the app
Get step-by-step solutions on Sovi AI
Photo-based solutions with guided steps
Explore more problems and detailed explanations
The first scatter plot has a "weak, linear, positive" correlation. The second scatter plot has a "weak, positive" (non - linear) correlation.