QUESTION IMAGE
Question
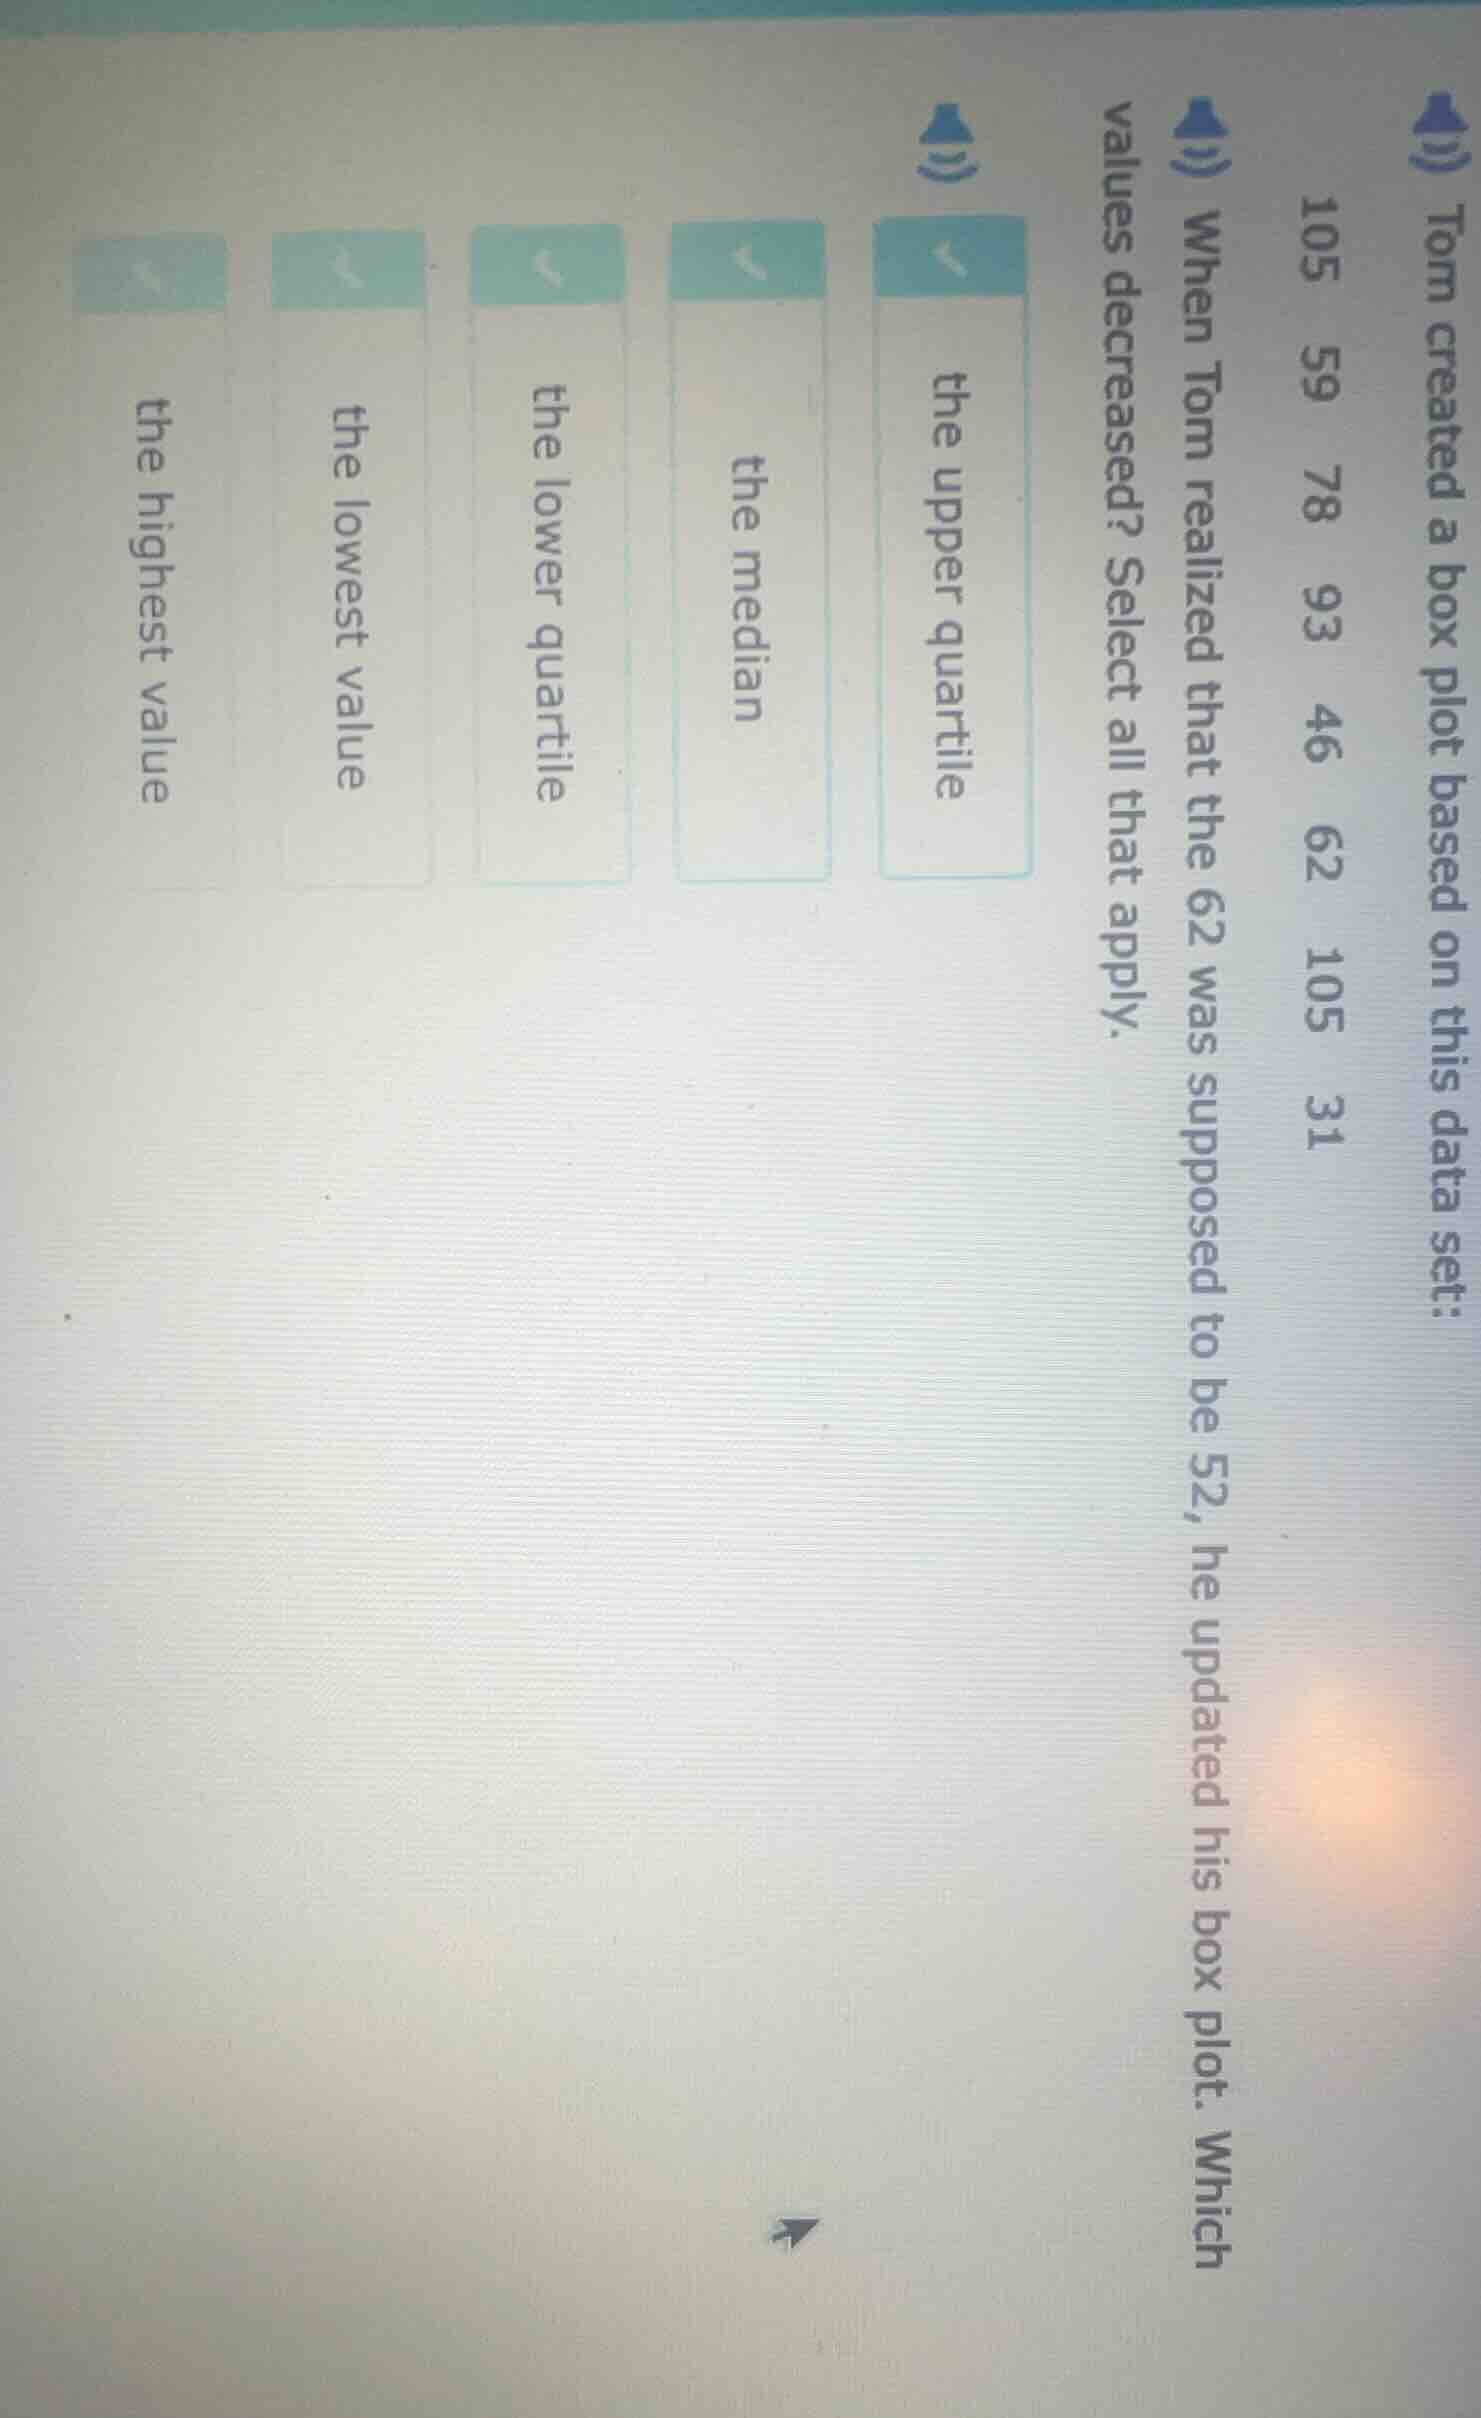
tom created a box plot based on this data set:
105 59 78 93 46 62 105 31
when tom realized that the 62 was supposed to be 52, he updated his box plot. which values decreased? select all that apply.
the upper quartile
the median
the lower quartile
the lowest value
the highest value
Step1: Order the original data set
First, we order the original data set: \( 31, 46, 59, 62, 78, 93, 105, 105 \) (Wait, actually, let's count the number of data points. The data set is: 105, 59, 78, 93, 46, 62, 105, 31. So when we order them from least to greatest: \( 31, 46, 59, 62, 78, 93, 105, 105 \). Wait, no, let's list all the numbers: 31, 46, 59, 62, 78, 93, 105, 105? Wait, the original data points: 105, 59, 78, 93, 46, 62, 105, 31. So that's 8 data points. So ordered: 31, 46, 59, 62, 78, 93, 105, 105. Now, the value 62 is being changed to 52. So the new data set will be: 31, 46, 52, 59, 78, 93, 105, 105 (after ordering the new data: 31, 46, 52, 59, 78, 93, 105, 105).
Step2: Analyze each measure
- Highest value: The highest values are 105, 105. Changing 62 to 52 doesn't affect the highest values. So highest value remains the same.
- Lowest value: The lowest value is 31. Changing 62 to 52 doesn't affect the lowest value. So lowest value remains the same.
- Lower quartile (Q1): For a data set with \( n = 8 \) (even number), the lower half is the first 4 data points. Original lower half: \( 31, 46, 59, 62 \). The median of the lower half (Q1) is the average of the 2nd and 3rd values? Wait, no, for even \( n \), the median is the average of the \( \frac{n}{2} \)th and \( (\frac{n}{2}+1) \)th values. But for quartiles, when \( n \) is even, we can split into lower half (first \( \frac{n}{2} \) values) and upper half (last \( \frac{n}{2} \) values). So original lower half: 31, 46, 59, 62 (first 4 values). The median of the lower half (Q1) is the average of the 2nd and 3rd values? Wait, no, for 4 values, the median (Q1) is the average of the 2nd and 3rd? Wait, no, when \( n \) is even, the lower quartile is the median of the lower half. So lower half: 31, 46, 59, 62. The median of these 4 is \( \frac{46 + 59}{2} = \frac{105}{2} = 52.5 \). Now, when we change 62 to 52, the new lower half is 31, 46, 52, 59. The median of this lower half (Q1) is \( \frac{46 + 52}{2} = \frac{98}{2} = 49 \). Wait, no, original lower half median (Q1) for original data (31,46,59,62) is the average of 46 and 59? Wait, no, for a data set with 8 values, the positions are: 1:31, 2:46, 3:59, 4:62, 5:78, 6:93, 7:105, 8:105. The lower quartile (Q1) is the median of the first 4 values (positions 1 - 4). So first 4: 31,46,59,62. The median of these 4 is the average of the 2nd and 3rd values? Wait, no, when there are 4 values, the median is the average of the 2nd and 3rd? Wait, no, for 4 values, the median (Q1 here) is the value at the 2.5th position? Wait, maybe a better way: for \( n = 8 \), the median (Q2) is the average of the 4th and 5th values. Original Q2: \( \frac{62 + 78}{2} = 70 \). New Q2: \( \frac{59 + 78}{2} = 68.5 \)? Wait, no, let's re - order the new data: 31, 46, 52, 59, 78, 93, 105, 105. So the 4th value is 59, 5th is 78. So median (Q2) is \( \frac{59 + 78}{2}=68.5 \), original median was \( \frac{62 + 78}{2}=70 \). So median decreases.
- Median: Original median (for \( n = 8 \)) is the average of the 4th and 5th values. Original 4th: 62, 5th:78. Median \(=\frac{62 + 78}{2}=70 \). New data: 31, 46, 52, 59, 78, 93, 105, 105. 4th value: 59, 5th:78. New median \(=\frac{59 + 78}{2}=68.5 \). So median decreases.
- Upper quartile (Q3): The upper half of the original data (for \( n = 8 \)) is the last 4 values: 78, 93, 105, 105. The median of the upper half (Q3) is the average of the 6th and 7th values (or the 2nd and 3rd in the upper half). Original Q3: \( \frac{93 + 105}{2}=99 \). New upper half: 78, 93, 105, 105. Median of u…

Snap & solve any problem in the app
Get step-by-step solutions on Sovi AI
Photo-based solutions with guided steps
Explore more problems and detailed explanations
the lower quartile, the median