QUESTION IMAGE
Question
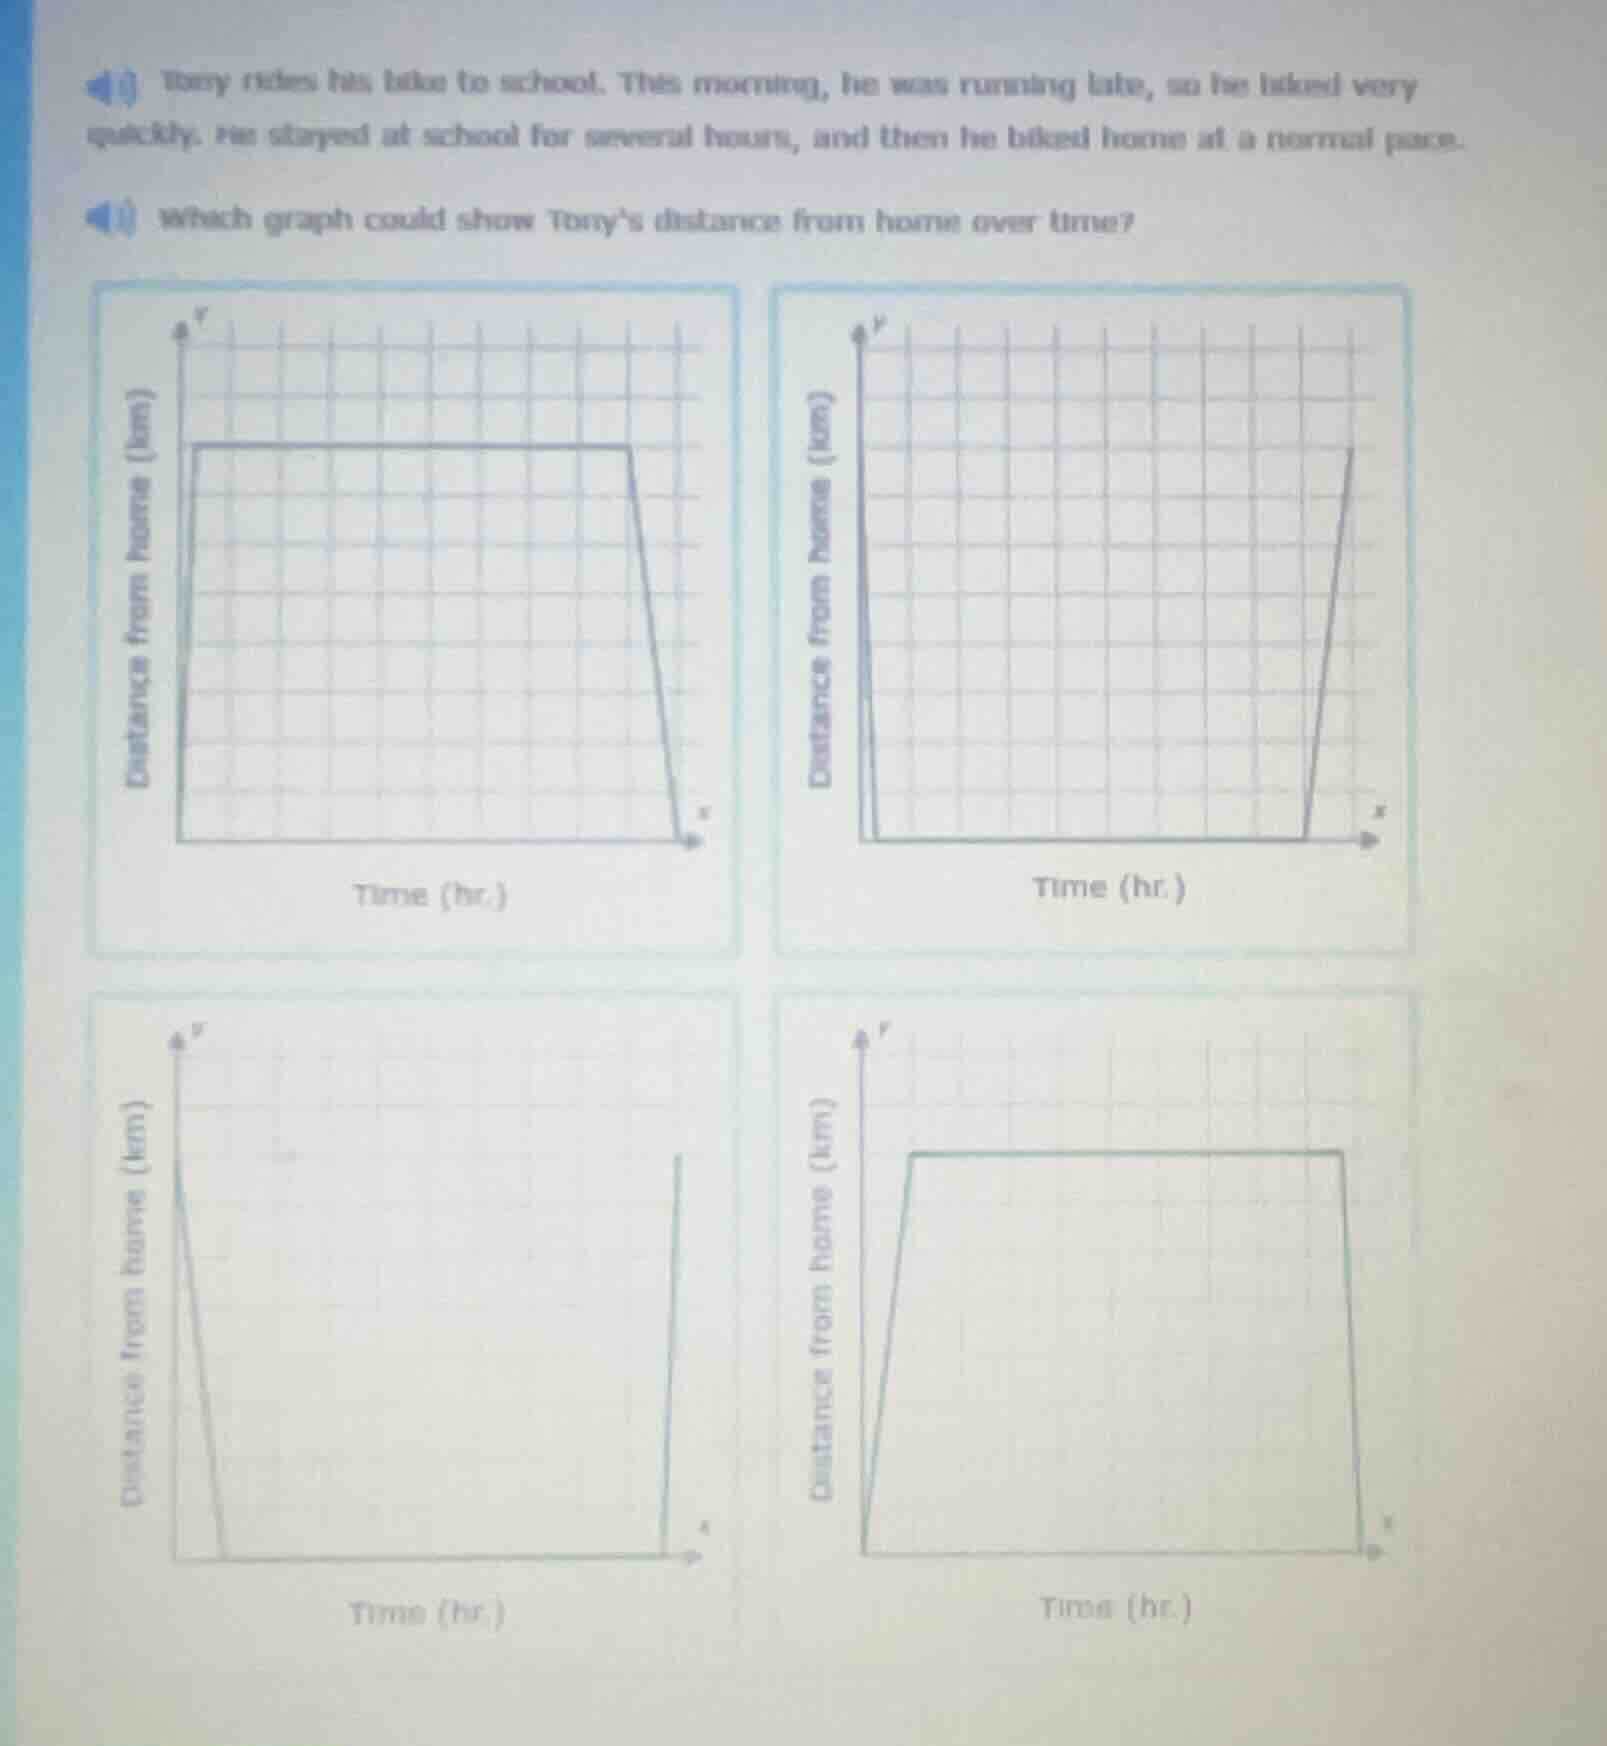
tony rides his bike to school. this morning, he was running late, so he biked very quickly. he stayed at school for several hours, and then he biked home at a normal pace. which graph could show tonys distance from home over time?
Step1: Analyze first segment (to school)
Tony bikes quickly to school, so distance from home increases steeply over a short time (steep positive slope).
Step2: Analyze second segment (at school)
He stays at school, so distance from home is constant (horizontal line, slope = 0) for several hours.
Step3: Analyze third segment (homeward)
He bikes home at a normal pace, which is slower than his fast trip to school. So distance from home decreases with a less steep negative slope than the first segment's positive slope.
Step4: Match to graphs
- Top-right, bottom-left graphs: Show distance decreasing first (wrong direction, starts at home).
- Bottom-right graph: Homeward slope is steeper than the trip to school (contradicts "normal pace" slower than fast trip).
- Top-left graph: Steep positive slope (fast to school), flat line (stays at school), steep (but correctly negative) slope home (slower pace would mean less steep, but this is the only graph with the correct direction and flat segment; the other options are invalid).

Snap & solve any problem in the app
Get step-by-step solutions on Sovi AI
Photo-based solutions with guided steps
Explore more problems and detailed explanations
The top-left graph (with a steep upward line, followed by a flat horizontal line, then a steep downward line to 0 distance from home)