QUESTION IMAGE
Question
of totalitarian governments after world war ii
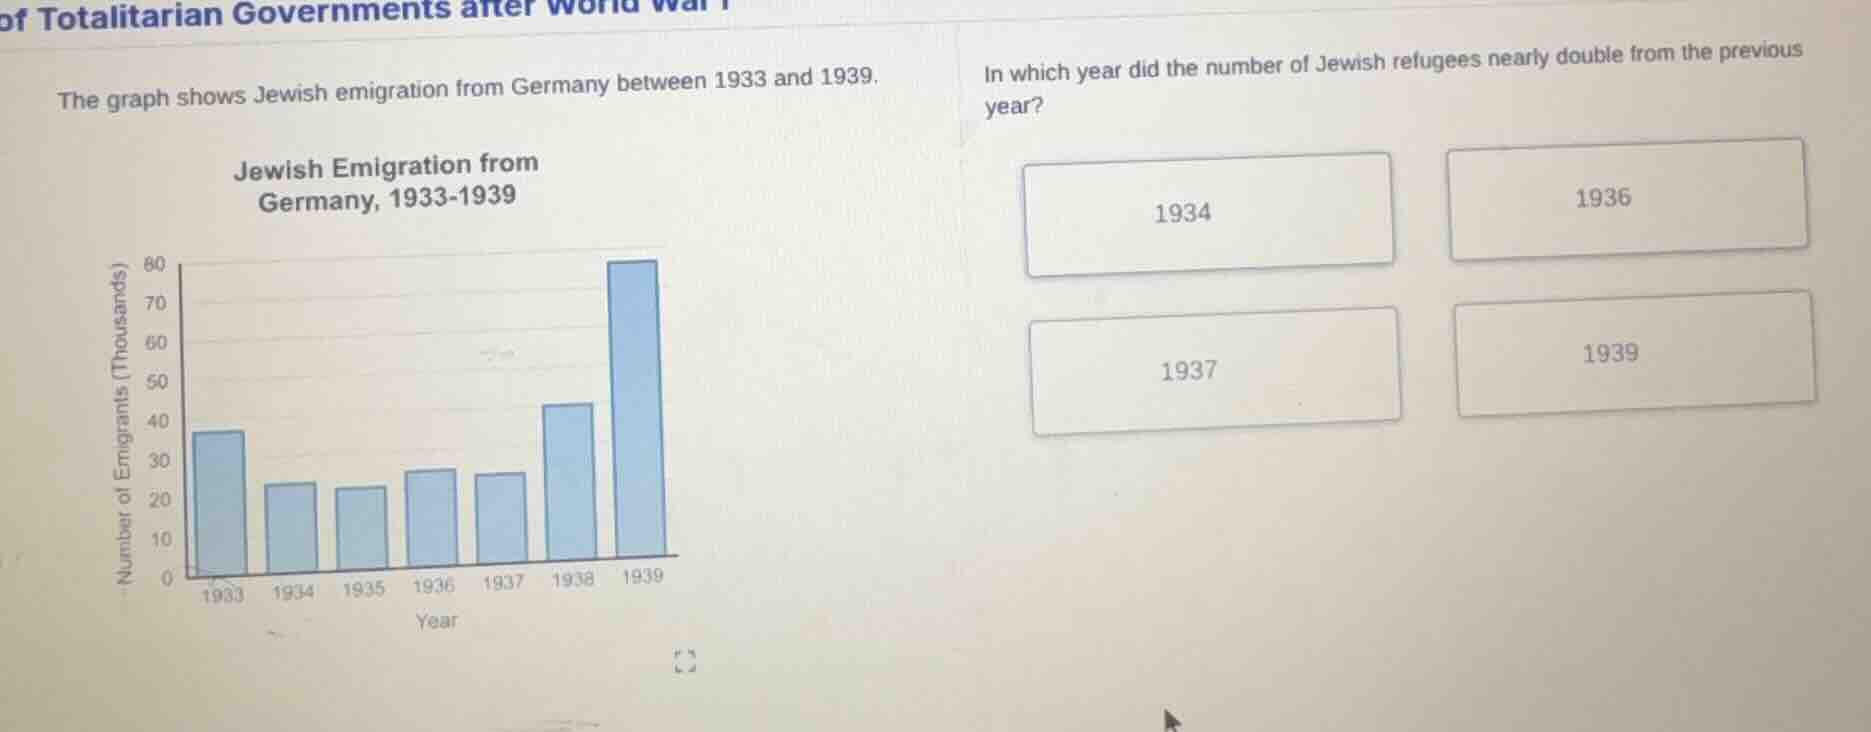
the graph shows jewish emigration from germany between 1933 and 1939.
in which year did the number of jewish refugees nearly double from the previous year?
1934
1936
1937
1939
Brief Explanations
- First, extract the approximate number of emigrants (in thousands) for each year from the bar graph:
- 1933: ~37
- 1934: ~24
- 1935: ~22
- 1936: ~27
- 1937: ~26
- 1938: ~44
- 1939: ~80
- Calculate the ratio of each year's emigrants to the previous year's to check for a near-double:
- 1934: $\frac{24}{37} \approx 0.65$
- 1935: $\frac{22}{24} \approx 0.92$
- 1936: $\frac{27}{22} \approx 1.23$
- 1937: $\frac{26}{27} \approx 0.96$
- 1938: $\frac{44}{26} \approx 1.69$
- 1939: $\frac{80}{44} \approx 1.82$
- The ratio closest to 2 (a doubling) is for 1939, where the number of refugees nearly doubles from 1938's total.

Snap & solve any problem in the app
Get step-by-step solutions on Sovi AI
Photo-based solutions with guided steps
Explore more problems and detailed explanations
1939