QUESTION IMAGE
Question
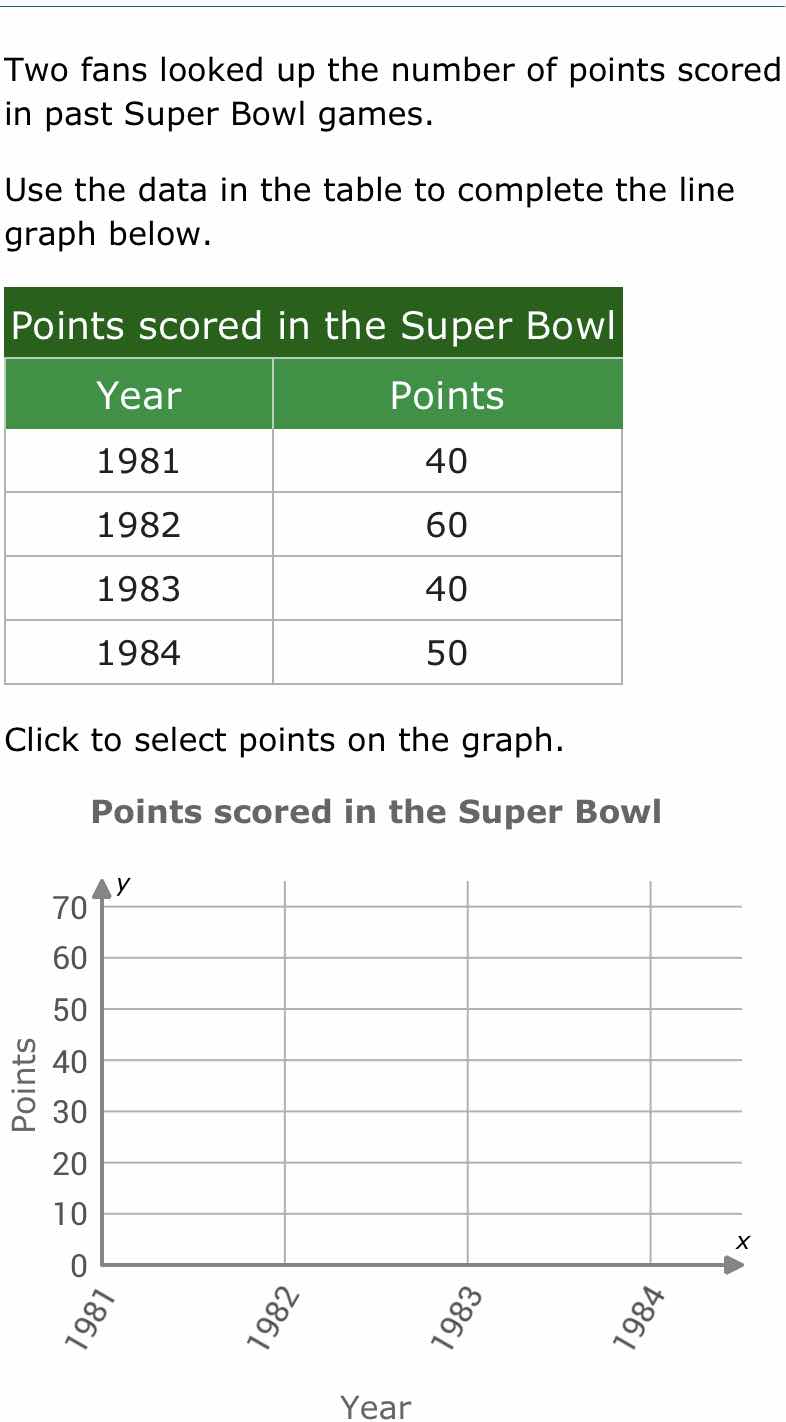
two fans looked up the number of points scored in past super bowl games. use the data in the table to complete the line graph below. points scored in the super bowl | year | points | | 1981 | 40 | | 1982 | 60 | | 1983 | 40 | | 1984 | 50 | click to select points on the graph. points scored in the super bowl (graph with x - axis as year (1981, 1982, 1983, 1984) and y - axis as points (0 - 70))
Step1: Plot 1981 data point
Locate 1981 on x-axis, 40 on y-axis: $(1981, 40)$
Step2: Plot 1982 data point
Locate 1982 on x-axis, 60 on y-axis: $(1982, 60)$
Step3: Plot 1983 data point
Locate 1983 on x-axis, 40 on y-axis: $(1983, 40)$
Step4: Plot 1984 data point
Locate 1984 on x-axis, 50 on y-axis: $(1984, 50)$
Step5: Connect plotted points
Draw line segments between consecutive points.

Snap & solve any problem in the app
Get step-by-step solutions on Sovi AI
Photo-based solutions with guided steps
Explore more problems and detailed explanations
The completed line graph has the following plotted points connected in order:
- $(1981, 40)$
- $(1982, 60)$
- $(1983, 40)$
- $(1984, 50)$