QUESTION IMAGE
Question
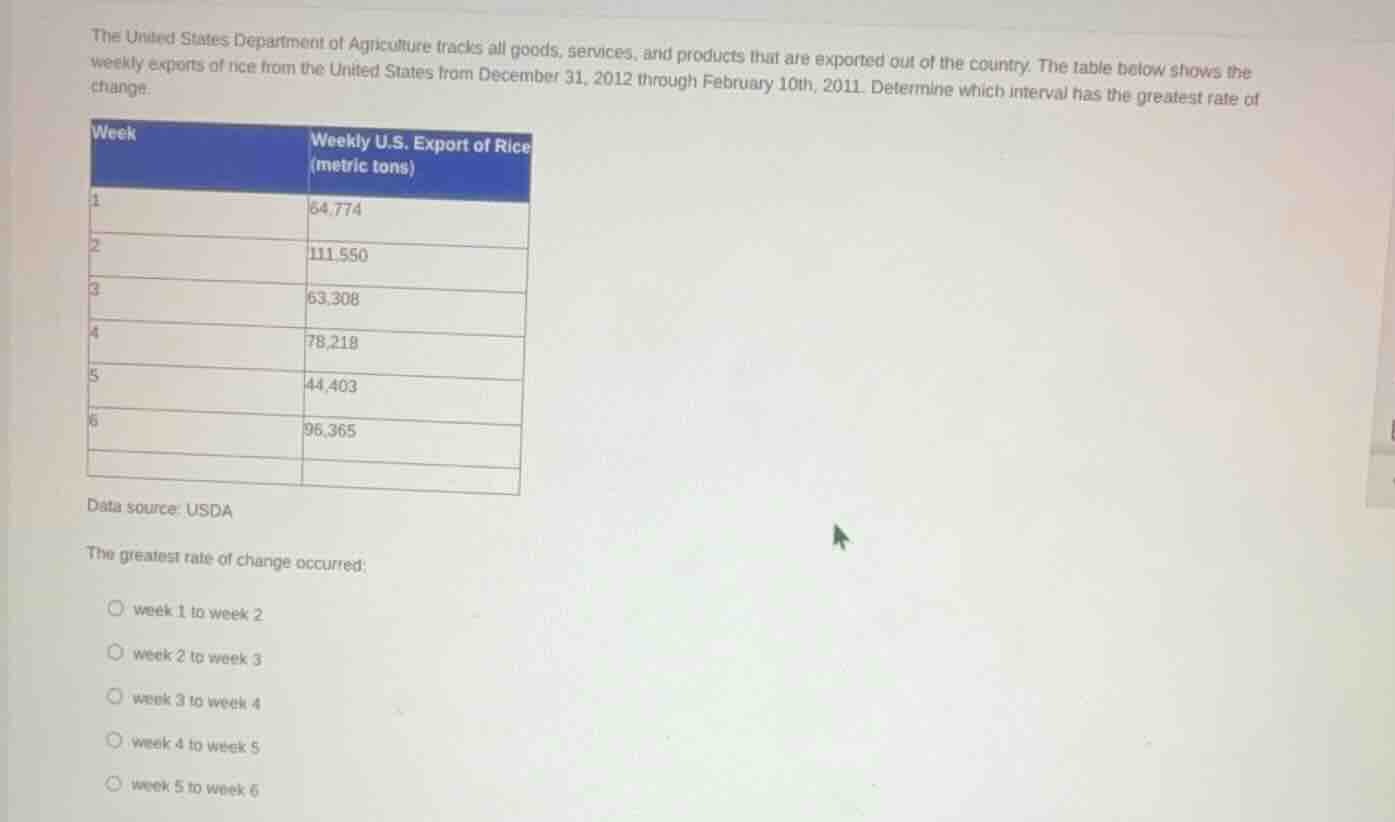
the united states department of agriculture tracks all goods, services, and products that are exported out of the country. the table below shows the weekly exports of rice from the united states from december 31, 2012 through february 10th, 2011. determine which interval has the greatest rate of change.week weekly u.s. export of rice (metric tons)1 64,7742 111,5503 63,3084 78,2185 44,4036 96,365data source: usdathe greatest rate of change occurred:○ week 1 to week 2○ week 2 to week 3○ week 3 to week 4○ week 4 to week 5○ week 5 to week 6
Step1: Calculate rate for week1-2
Rate = $\frac{111550 - 64774}{2-1} = 46776$
Step2: Calculate rate for week2-3
Rate = $\frac{63308 - 111550}{3-2} = -48242$
Step3: Calculate rate for week3-4
Rate = $\frac{78218 - 63308}{4-3} = 14910$
Step4: Calculate rate for week4-5
Rate = $\frac{44403 - 78218}{5-4} = -33815$
Step5: Calculate rate for week5-6
Rate = $\frac{96365 - 44403}{6-5} = 51962$
Step6: Compare all rates
The greatest positive rate is 51962, from week5 to week6.

Snap & solve any problem in the app
Get step-by-step solutions on Sovi AI
Photo-based solutions with guided steps
Explore more problems and detailed explanations
week 5 to week 6