QUESTION IMAGE
Question
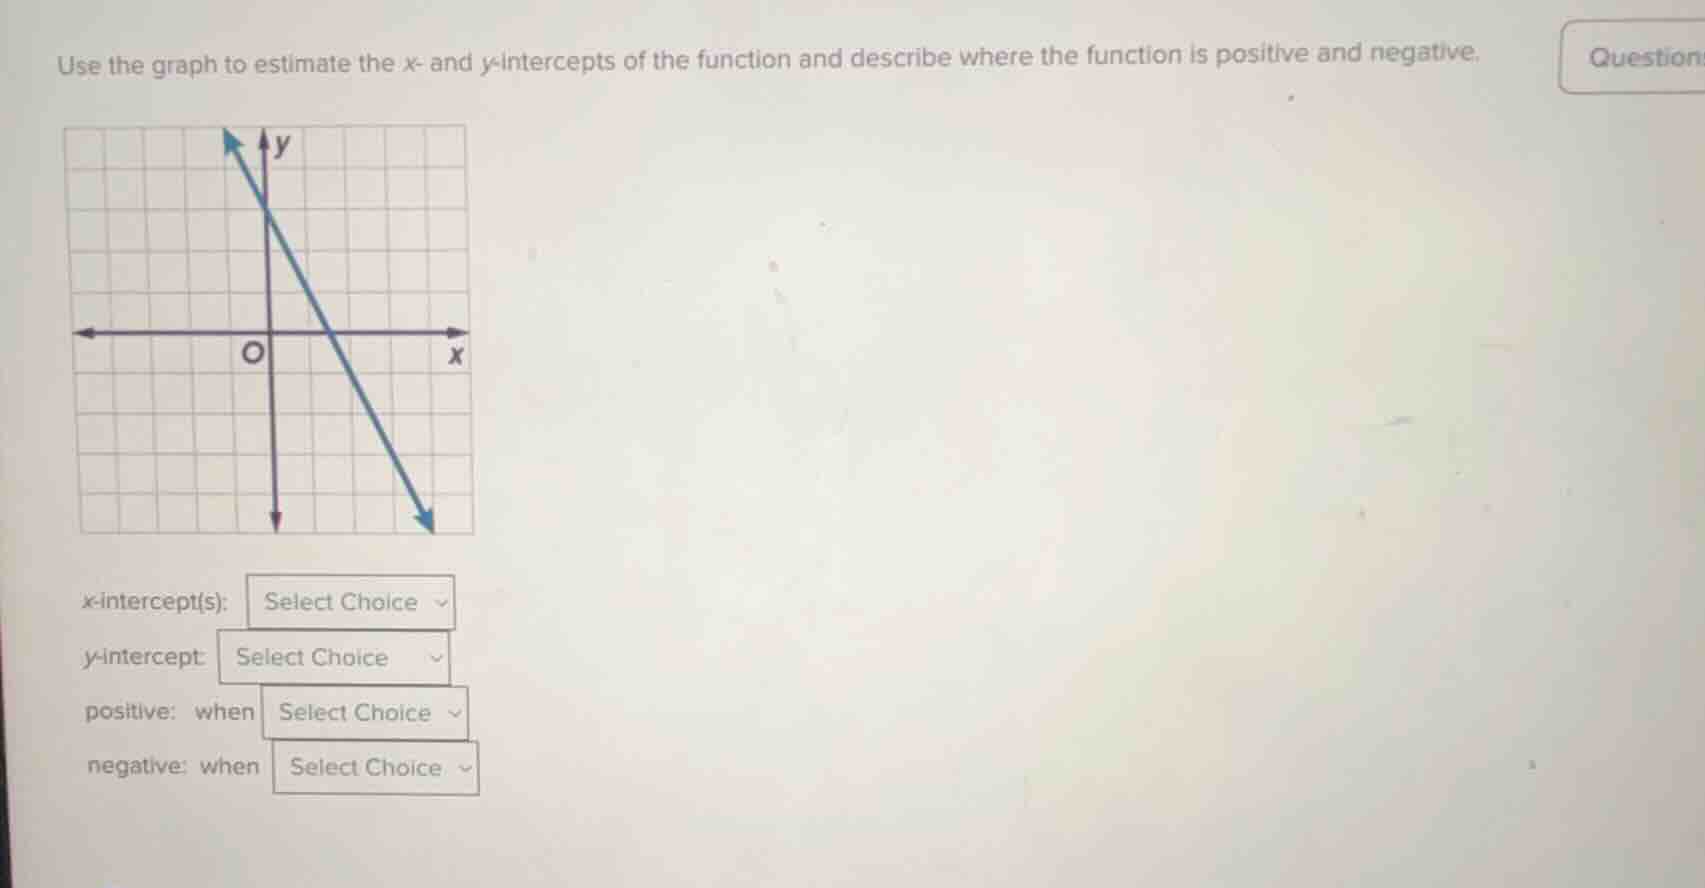
use the graph to estimate the x- and y-intercepts of the function and describe where the function is positive and negative.
x-intercept(s): select choice
y-intercept: select choice
positive: when select choice
negative: when select choice
Step1: Find x - intercept
The x - intercept is the point where the graph crosses the x - axis. From the graph, the line crosses the x - axis at \(x = 1\) (assuming the grid has each square as 1 unit). So the x - intercept is \((1,0)\) or \(x = 1\).
Step2: Find y - intercept
The y - intercept is the point where the graph crosses the y - axis. From the graph, the line crosses the y - axis at \(y=2\) (assuming the grid has each square as 1 unit). So the y - intercept is \((0,2)\) or \(y = 2\).
Step3: Determine where the function is positive
A function is positive when its graph is above the x - axis. From the graph, the line is above the x - axis when \(x<1\) (since the line crosses the x - axis at \(x = 1\) and is decreasing).
Step4: Determine where the function is negative
A function is negative when its graph is below the x - axis. From the graph, the line is below the x - axis when \(x>1\) (since the line crosses the x - axis at \(x = 1\) and is decreasing).

Snap & solve any problem in the app
Get step-by-step solutions on Sovi AI
Photo-based solutions with guided steps
Explore more problems and detailed explanations
x - intercept: \(x = 1\) (or the point \((1,0)\))
y - intercept: \(y=2\) (or the point \((0,2)\))
positive: when \(x < 1\)
negative: when \(x>1\)