QUESTION IMAGE
Question
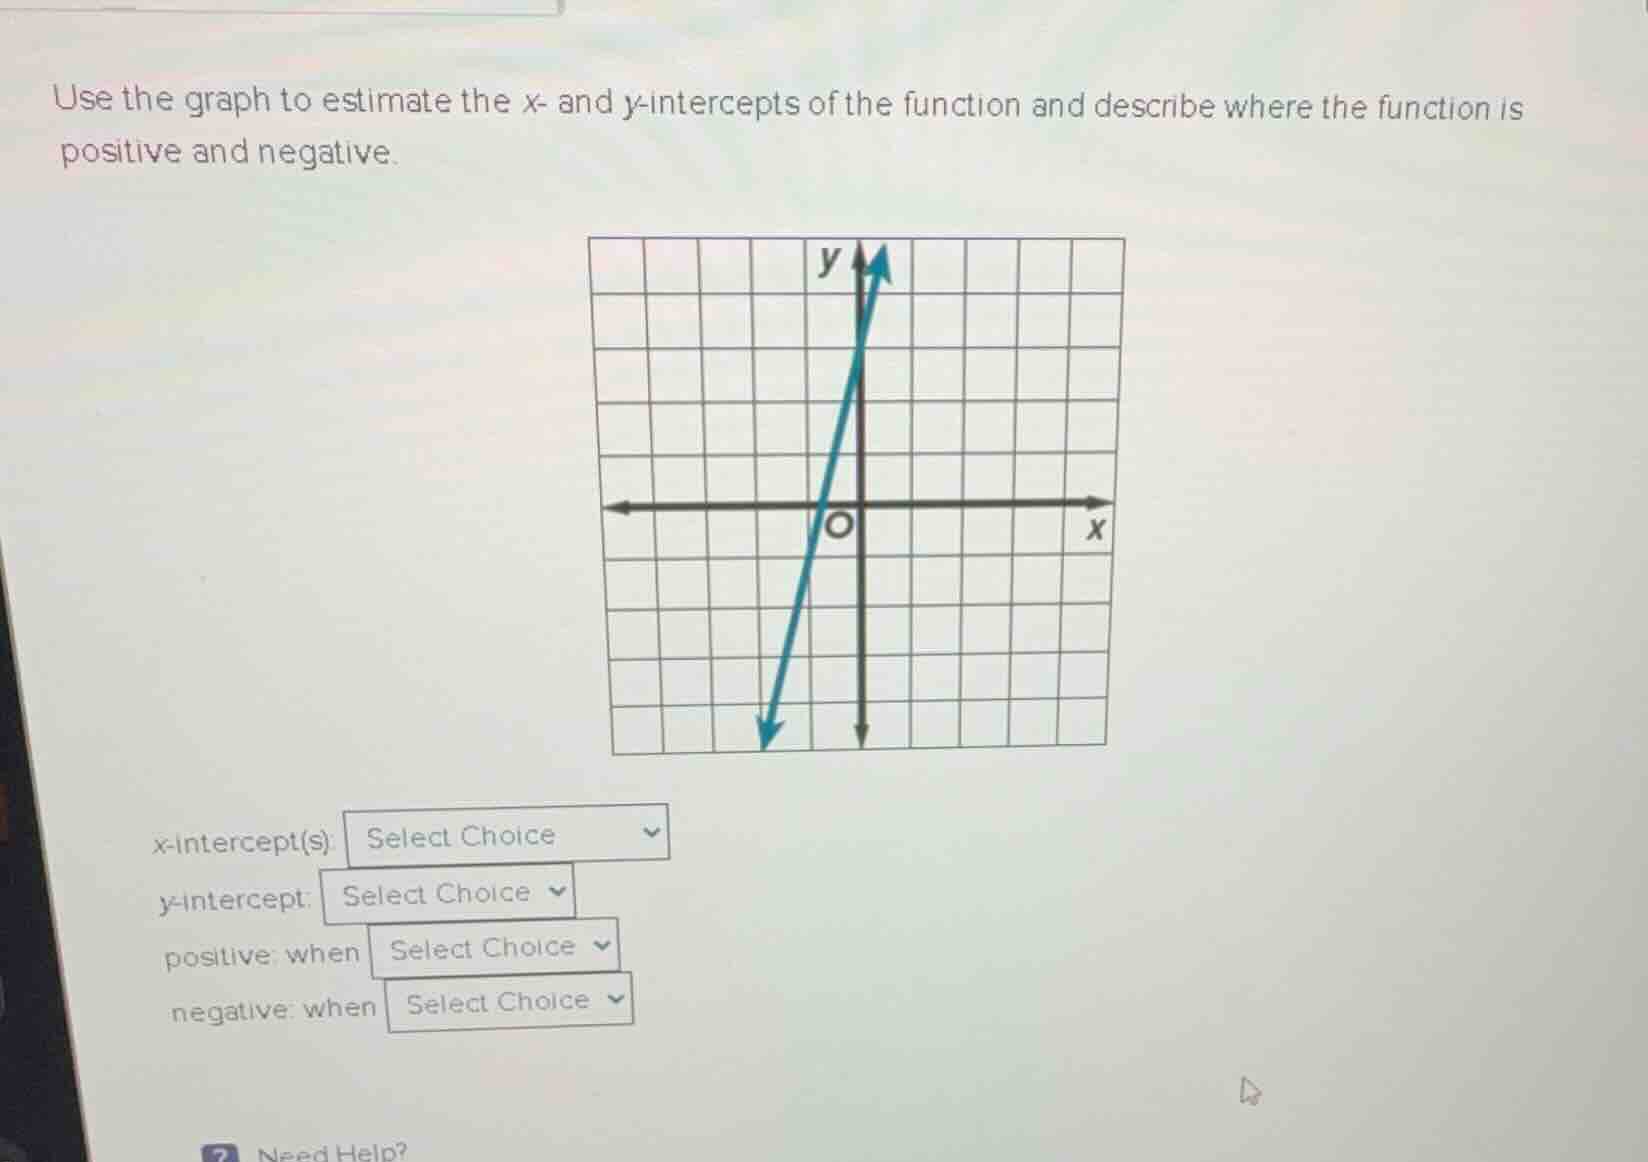
use the graph to estimate the x- and y-intercepts of the function and describe where the function is positive and negative.
x-intercept(s) select choice
y-intercept: select choice
positive: when select choice
negative: when select choice
Step1: Find x-intercept
The x-intercept is where the line crosses the x-axis. From the graph, this occurs at $x=-1$, so the x-intercept is $(-1, 0)$.
Step2: Find y-intercept
The y-intercept is where the line crosses the y-axis. From the graph, this occurs at $y=3$, so the y-intercept is $(0, 3)$.
Step3: Identify positive interval
The function is positive where its graph is above the x-axis. This happens when $x > -1$.
Step4: Identify negative interval
The function is negative where its graph is below the x-axis. This happens when $x < -1$.

Snap & solve any problem in the app
Get step-by-step solutions on Sovi AI
Photo-based solutions with guided steps
Explore more problems and detailed explanations
x-intercept(s): $(-1, 0)$
y-intercept: $(0, 3)$
positive: when $x > -1$
negative: when $x < -1$