QUESTION IMAGE
Question
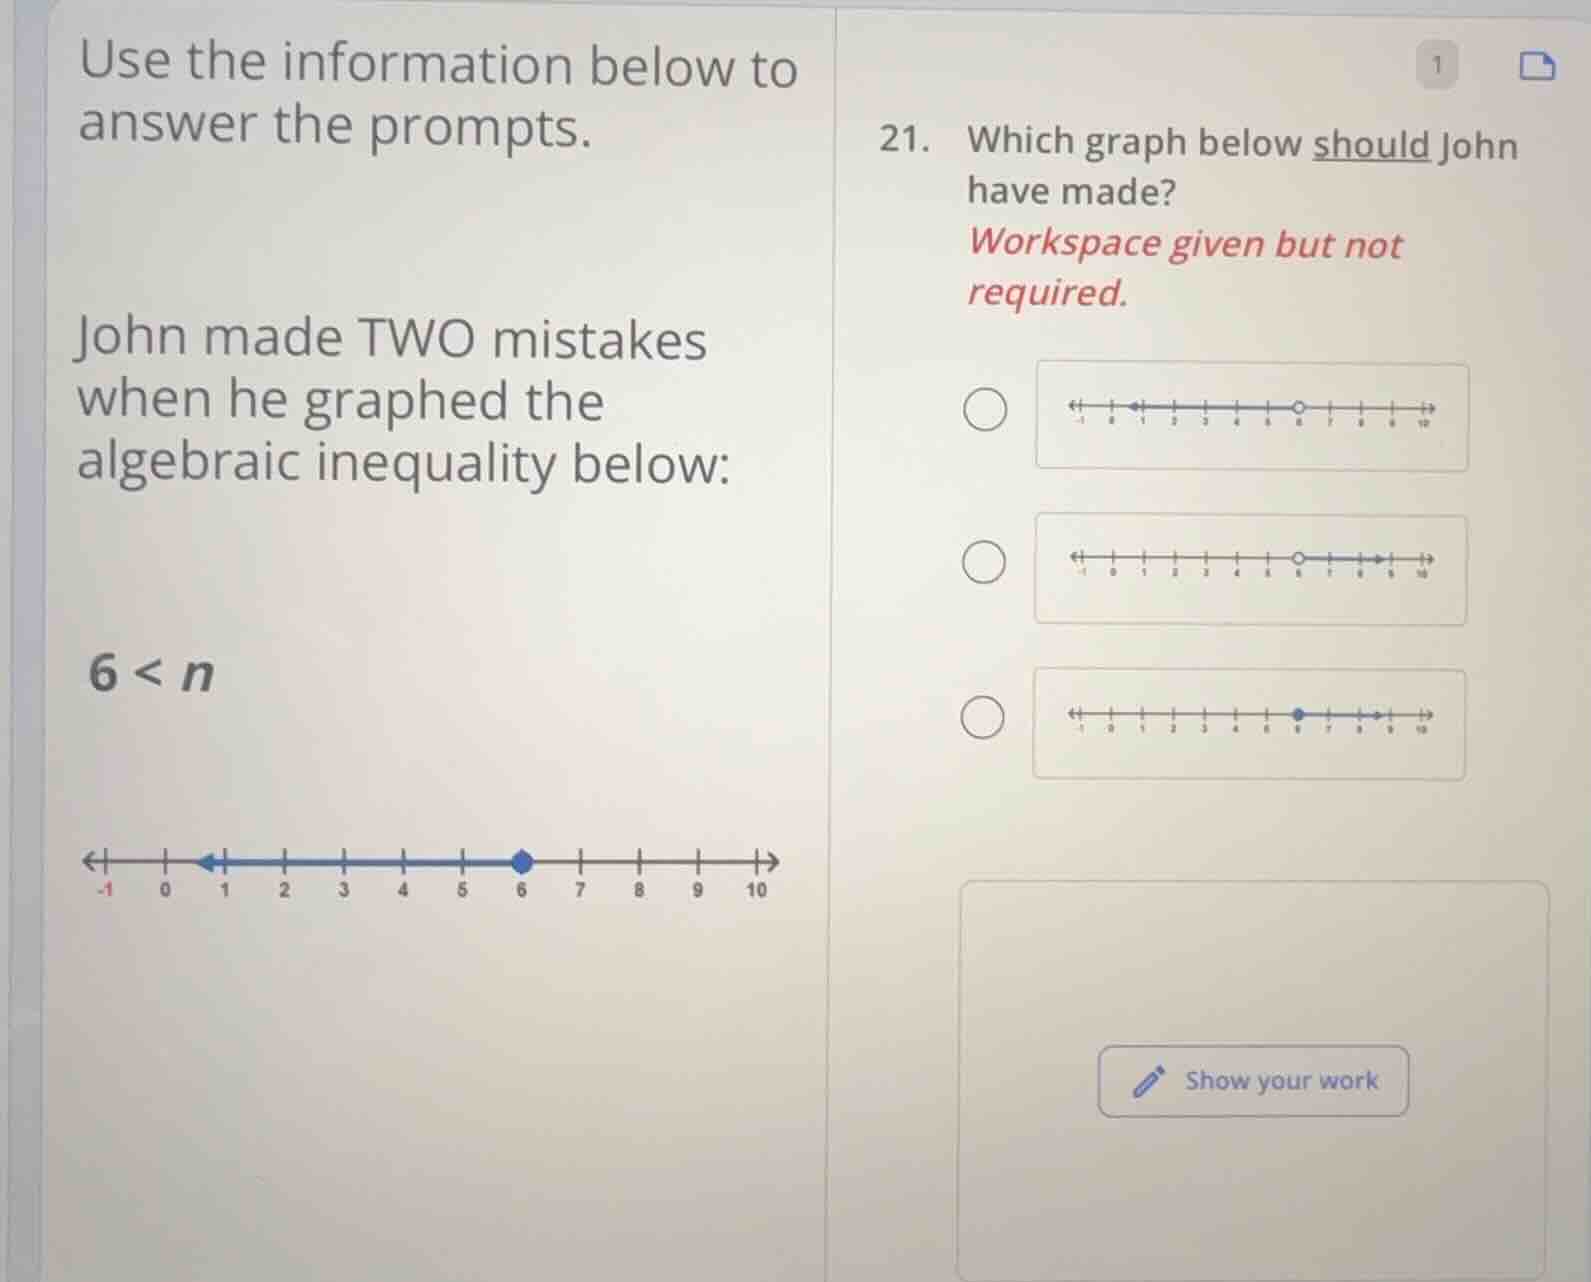
use the information below to answer the prompts.
john made two mistakes when he graphed the algebraic inequality below:
$6 < n$
number line image
- which graph below should john have made?
workspace given but not required.
three number line graph options
Step 1: Analyze the inequality \(6 < n\)
The inequality \(6 < n\) (which is the same as \(n > 6\)) means we are looking for all numbers greater than 6. For graphing this on a number line:
- The circle at 6 should be open (since 6 is not included in the solution set, as the inequality is strict, \(n>6\) not \(n\geq6\)).
- The arrow should point to the right (since we want values greater than 6).
Step 2: Evaluate the given options
- First option: Arrow points left, which is for values less than a number, so incorrect.
- Second option: Open circle at 6 and arrow pointing right, which matches \(n > 6\) (since open circle means 6 is not included and right arrow means greater than 6).
- Third option: Filled circle at 6 (which would be for \(n\geq6\)) and arrow direction? Wait, no, the third option's filled circle is wrong for \(n > 6\), and also the arrow? Wait, no, the second option has open circle at 6 and right arrow, which is correct for \(n>6\).

Snap & solve any problem in the app
Get step-by-step solutions on Sovi AI
Photo-based solutions with guided steps
Explore more problems and detailed explanations
The second graph (the one with open circle at 6 and arrow pointing to the right)