QUESTION IMAGE
Question
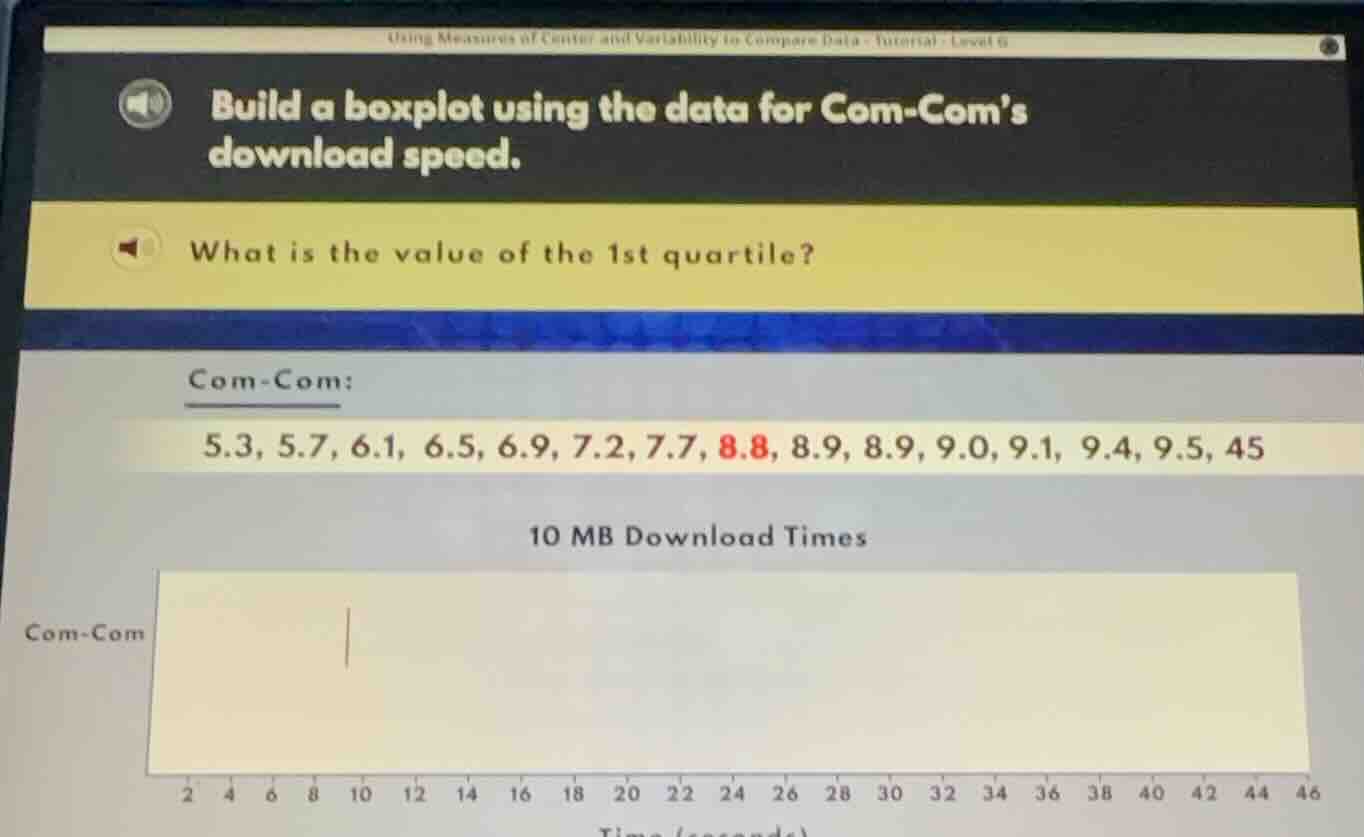
using measures of center and variability to compare data - tutorial - level g build a boxplot using the data for com - com’s download speed. what is the value of the 1st quartile? com - com: 5.3, 5.7, 6.1, 6.5, 6.9, 7.2, 7.7, 8.8, 8.9, 8.9, 9.0, 9.1, 9.4, 9.5, 45 10 mb download times
Step1: Confirm sorted data
Data is already sorted: $5.3, 5.7, 6.1, 6.5, 6.9, 7.2, 7.7, 8.8, 8.9, 8.9, 9.0, 9.1, 9.4, 9.5, 45$
Step2: Calculate position of Q1
Use formula $\text{Position of } Q_1 = \frac{n+1}{4}$, where $n=15$
$\text{Position} = \frac{15+1}{4} = 4$
Step3: Identify Q1 value
The 4th value in sorted data is $6.5$

Snap & solve any problem in the app
Get step-by-step solutions on Sovi AI
Photo-based solutions with guided steps
Explore more problems and detailed explanations
$6.5$