QUESTION IMAGE
Question
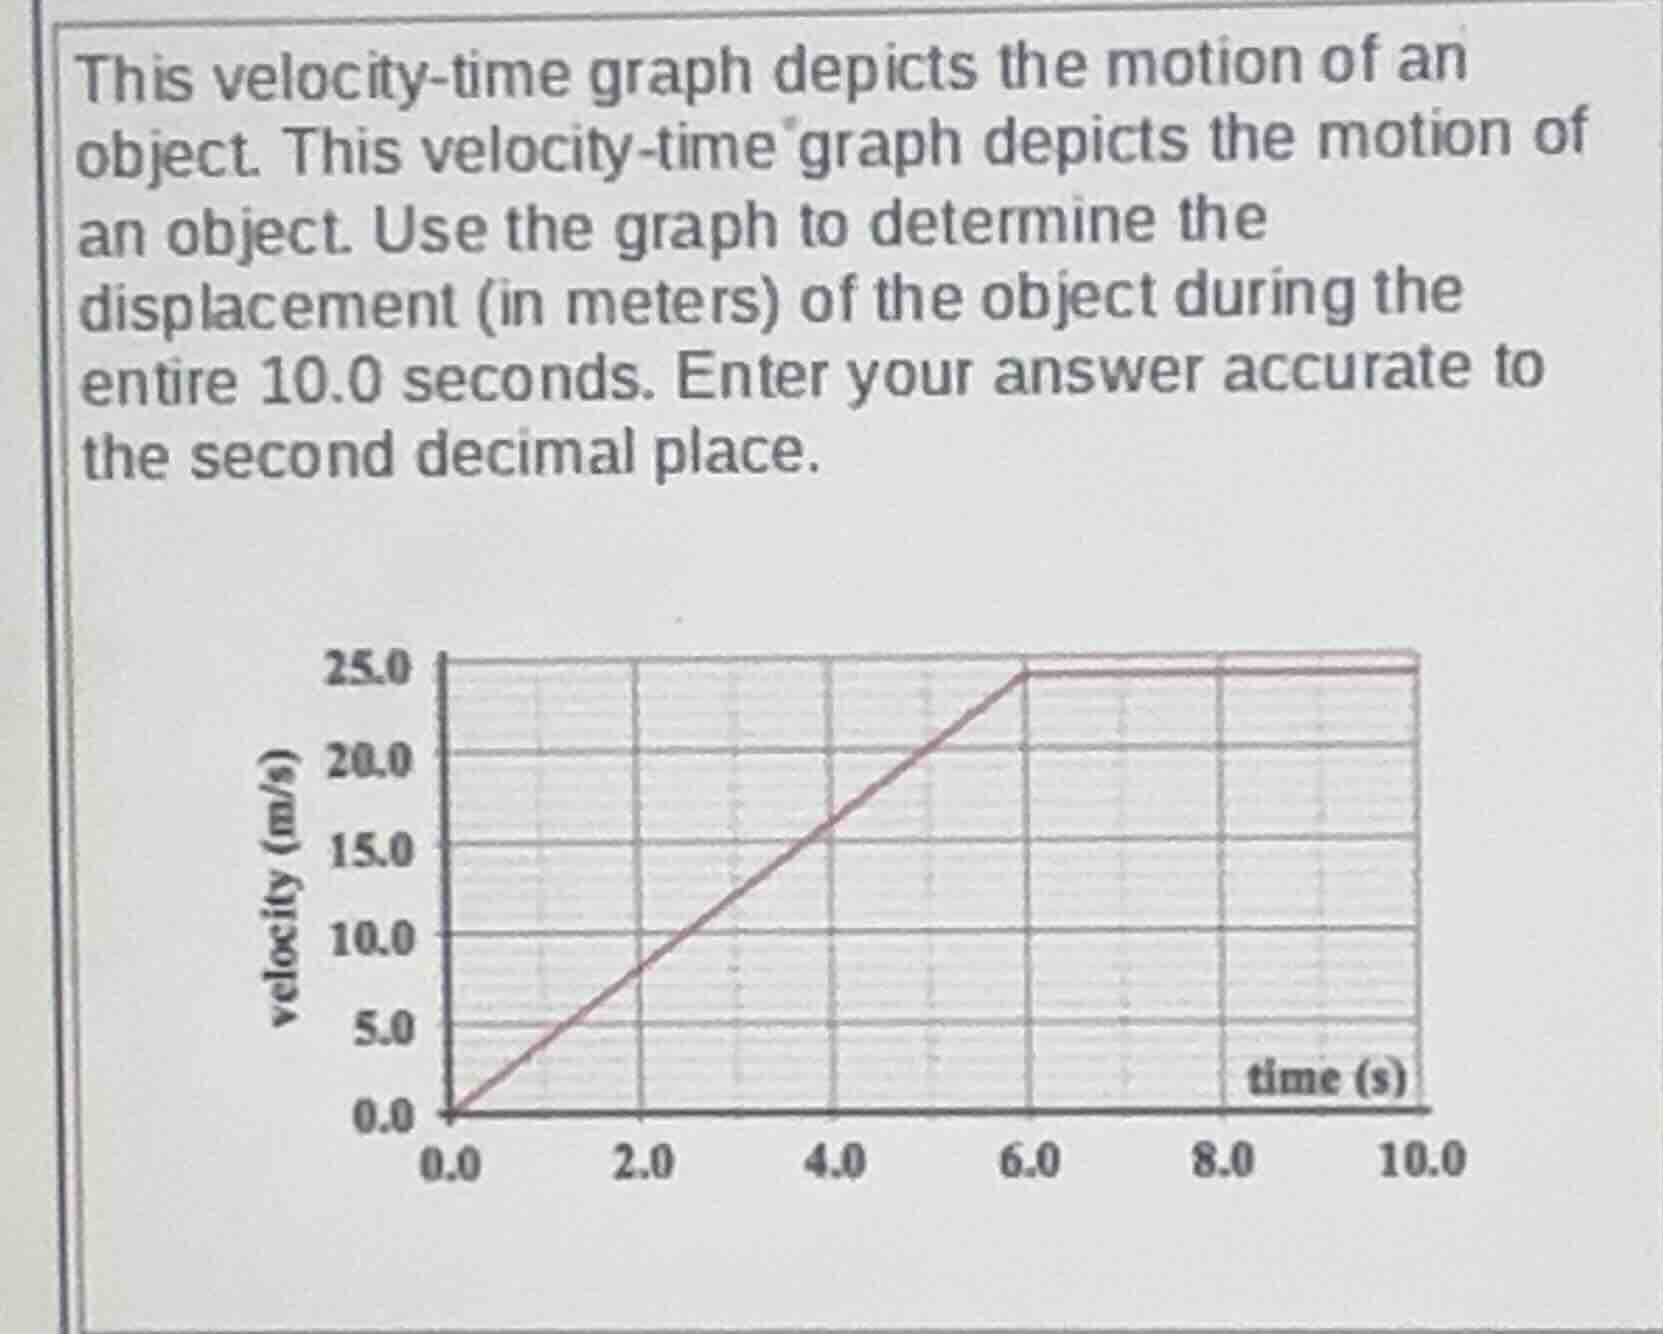
this velocity-time graph depicts the motion of an object. this velocity-time graph depicts the motion of an object. use the graph to determine the displacement (in meters) of the object during the entire 10.0 seconds. enter your answer accurate to the second decimal place.
Step1: Split graph into two shapes
The graph has a triangle (0-6s) and a rectangle (6-10s).
Step2: Calculate triangle area (displacement)
Area of triangle: $\frac{1}{2} \times \text{base} \times \text{height} = \frac{1}{2} \times 6.0\ \text{s} \times 25.0\ \text{m/s} = 75.00\ \text{m}$
Step3: Calculate rectangle area (displacement)
Area of rectangle: $\text{length} \times \text{width} = (10.0-6.0)\ \text{s} \times 25.0\ \text{m/s} = 4.0 \times 25.0 = 100.00\ \text{m}$
Step4: Sum the two displacements
Total displacement: $75.00\ \text{m} + 100.00\ \text{m}$

Snap & solve any problem in the app
Get step-by-step solutions on Sovi AI
Photo-based solutions with guided steps
Explore more problems and detailed explanations
175.00 meters