QUESTION IMAGE
Question
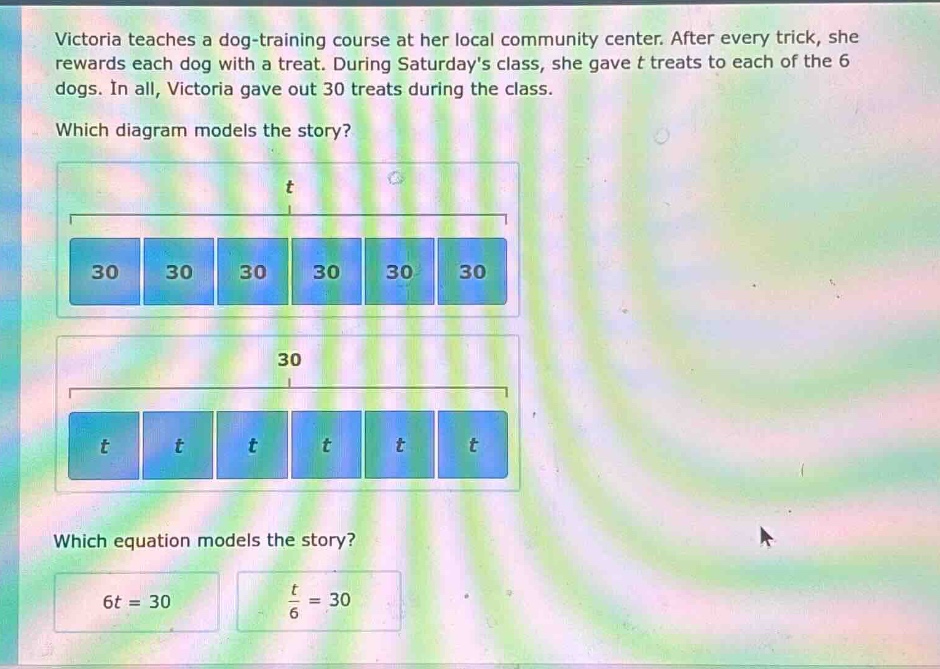
victoria teaches a dog - training course at her local community center. after every trick, she rewards each dog with a treat. during saturday’s class, she gave t treats to each of the 6 dogs. in all, victoria gave out 30 treats during the class.
which diagram models the story?
diagram 1: a rectangle with a segment labeled t at the top, and six blue rectangles each labeled 30 inside it
diagram 2: a rectangle with a segment labeled 30 at the top, and six blue rectangles each labeled t inside it
which equation models the story?
$6t = 30$ $\frac{t}{6}=30$
Part 1: Which diagram models the story?
We have 6 dogs, and each dog gets \( t \) treats. The total number of treats is 30. So we need a diagram where there are 6 parts (for 6 dogs) each labeled \( t \), and the total is 30. The second diagram has 6 boxes labeled \( t \) with a total of 30, which matches the situation (6 dogs, each with \( t \) treats, total 30). The first diagram has 6 boxes of 30, which doesn't match as we have 6 dogs with \( t \) treats, not 6 groups of 30.
Step1: Define the relationship
There are 6 dogs, and each dog gets \( t \) treats. So the total number of treats is the number of dogs times the treats per dog.
Step2: Write the equation
Number of dogs is 6, treats per dog is \( t \), total treats is 30. So the equation is \( 6\times t = 30 \), which is \( 6t = 30 \). The other equation \( \frac{t}{6}=30 \) would mean \( t = 180 \), which doesn't match the situation.

Snap & solve any problem in the app
Get step-by-step solutions on Sovi AI
Photo-based solutions with guided steps
Explore more problems and detailed explanations
The second diagram (with 6 boxes labeled \( t \) and a total of 30)