QUESTION IMAGE
Question
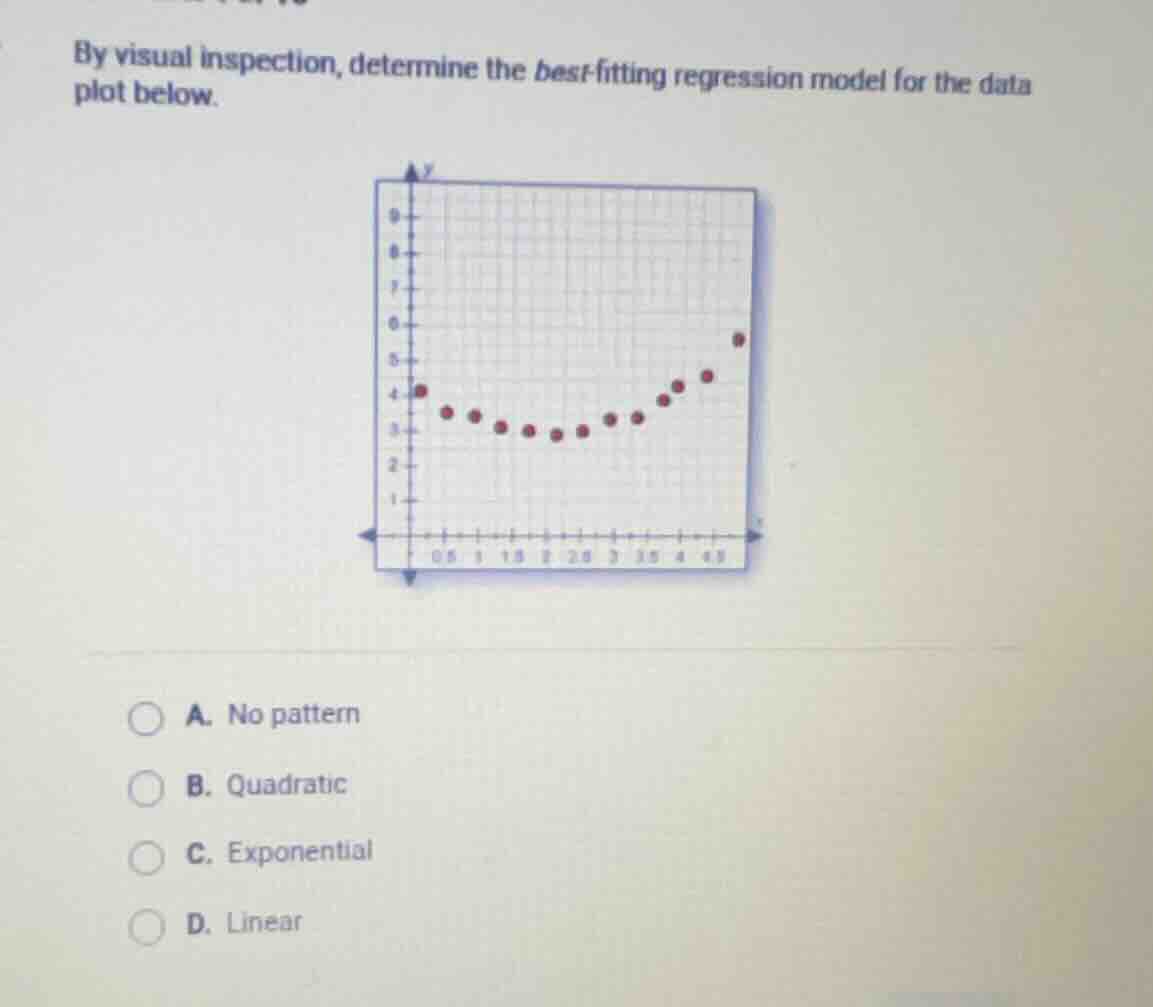
by visual inspection, determine the best-fitting regression model for the data plot below.
a. no pattern
b. quadratic
c. exponential
d. linear
Brief Explanations
The data points first decrease to a minimum and then increase, forming a U-shaped curve. This matches the shape of a quadratic function, which has a parabolic curve that can have a single minimum or maximum point. A linear model would show a straight line, exponential shows consistent growth/decay, and there is a clear pattern present.

Snap & solve any problem in the app
Get step-by-step solutions on Sovi AI
Photo-based solutions with guided steps
Explore more problems and detailed explanations
B. Quadratic