QUESTION IMAGE
Question
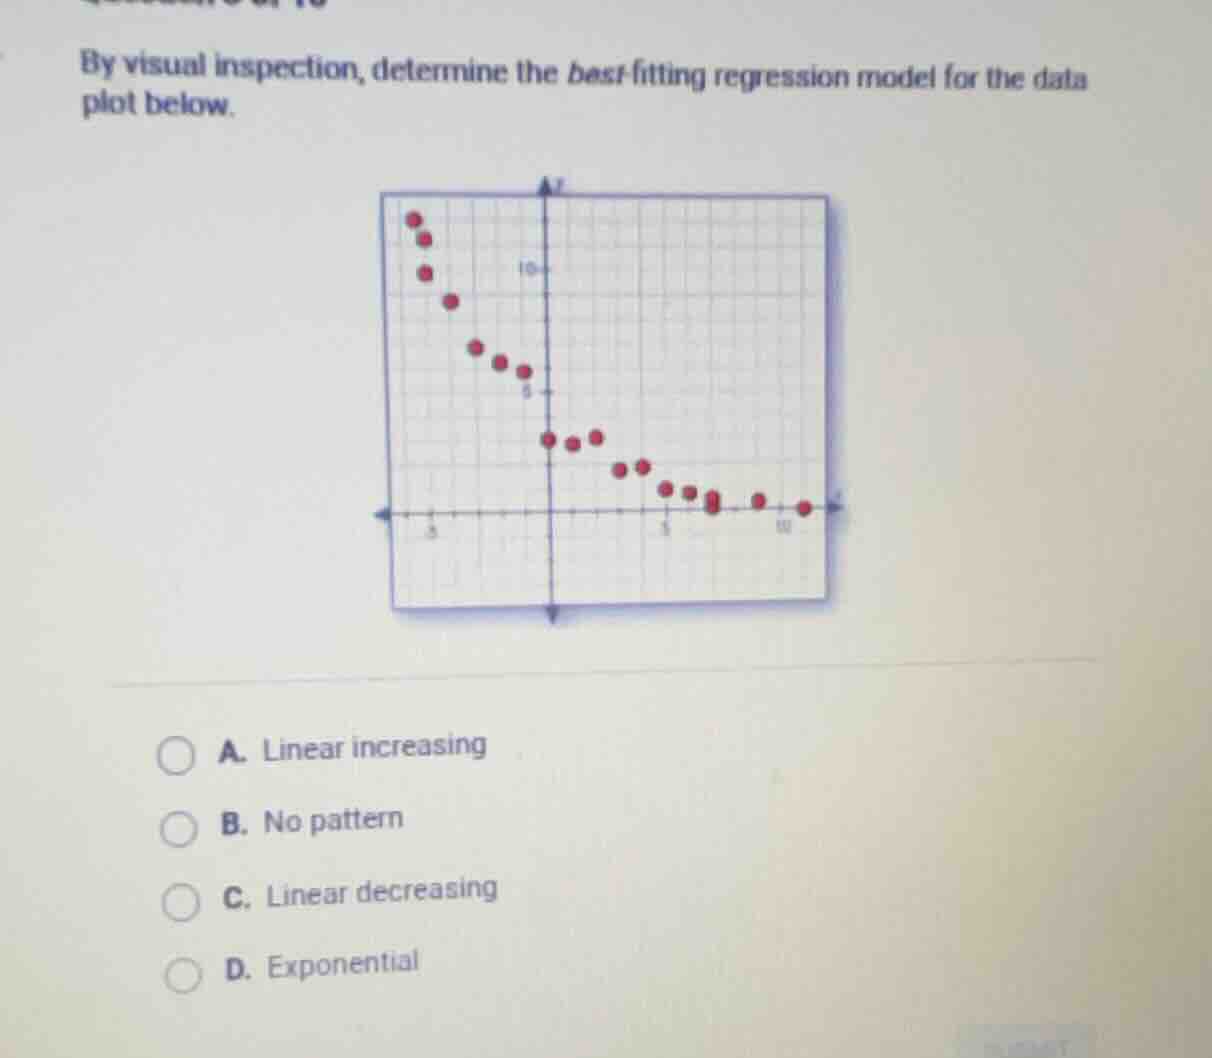
by visual inspection, determine the best-fitting regression model for the data plot below.
a. linear increasing
b. no pattern
c. linear decreasing
d. exponential
Brief Explanations
The data points show a rapid decrease at first, then the rate of decrease slows down and approaches a horizontal asymptote, which matches the shape of an exponential decay curve. A linear model would show a steady, constant rate of change, which is not observed here, and there is a clear decreasing pattern.

Snap & solve any problem in the app
Get step-by-step solutions on Sovi AI
Photo-based solutions with guided steps
Explore more problems and detailed explanations
D. Exponential