QUESTION IMAGE
Question
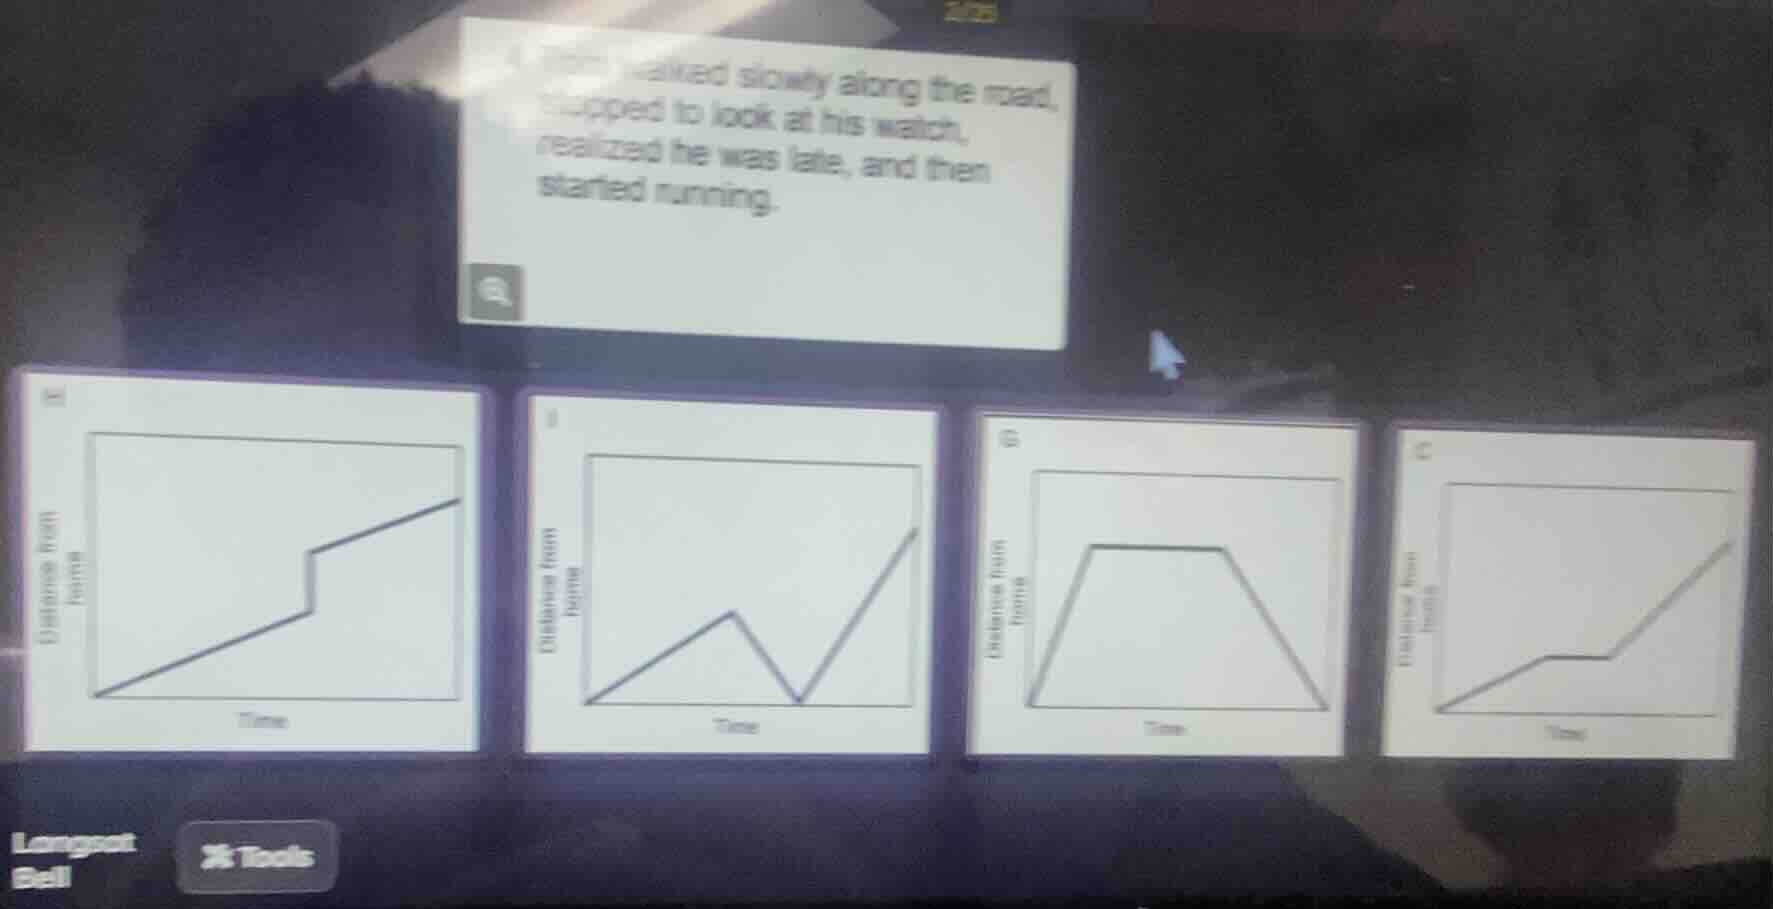
walked slowly along the road, stopped to look at his watch, realized he was late, and then started running.
Step1: Analyze the motion description
Bob first walks slowly (constant, slow speed), then stops (speed = 0, distance from start doesn't change), then runs (constant, faster speed than walking). We need a graph where distance from start increases slowly, then is constant (horizontal line), then increases faster.
Step2: Evaluate each graph
- First graph: Two increasing segments, second steeper (no stop). Incorrect.
- Second graph: Distance decreases, then increases. Incorrect (distance from start should not decrease).
- Third graph: Distance increases, then constant, then decreases. Incorrect (distance from start shouldn't decrease).
- Fourth graph (assuming the last one with a flat part then steeper? Wait, re - check. Wait, the correct graph should have: slow increase (walking), flat (stopped), fast increase (running). Wait, maybe I mislabeled. Wait, the first graph (leftmost) has two increasing parts, second steeper. No, the fourth graph (rightmost) has a slow increase, then flat (stopped), then steeper? Wait, no, the labels: Wait, the problem's graphs: Let's re - express. The key is: when moving, distance from start increases (positive slope). When stopped, slope is 0 (horizontal line). Walking: small slope, running: large slope.
Wait, the correct graph should have:
- Initial segment: positive slope (walking, slow)
- Middle segment: slope 0 (stopped, looking at watch)
- Final segment: positive slope (running, steeper than first)
Looking at the graphs: The fourth graph (labeled C? Or the left - most? Wait, no, the left - most has two increasing parts, second steeper (no stop). The right - most (fourth) has a slow increase, then flat, then steeper? Wait, maybe the fourth graph (the one with a flat part in the middle) is correct? Wait, no, the third graph has a flat part but then decreases. Wait, maybe I made a mistake. Wait, the description: "walked slowly along the road" (distance from start increases, slow speed: small slope), "stopped to look at his watch" (distance from start constant: horizontal line), "realized he was late, and then started running" (distance from start increases, faster speed: steeper slope than first).
So the graph should have:
- First part: positive, small slope
- Second part: horizontal (slope 0)
- Third part: positive, large slope
Looking at the graphs, the fourth graph (rightmost) has a slow increase, then flat, then steeper? Wait, no, the third graph (labeled G) has an increase, then flat, then decrease. No. Wait, the left - most graph: two increasing, second steeper (no stop). The fourth graph (right - most) has a slow increase, then flat, then steeper? Wait, maybe the correct graph is the one with a flat segment (stopped) and then steeper. Wait, maybe the fourth graph (the one with a flat part in the middle) is correct. Wait, no, the third graph (G) has a flat part but then decreases. So maybe the fourth graph (the right - most) is correct? Wait, no, let's re - check the labels. Wait, the user's image: four graphs. Let's assume the fourth graph (rightmost) has:
- First segment: slow increase (walking)
- Second segment: flat (stopped)
- Third segment: steeper increase (running)
Yes, that matches. So the correct graph is the fourth one (assuming the right - most graph has that pattern).

Snap & solve any problem in the app
Get step-by-step solutions on Sovi AI
Photo-based solutions with guided steps
Explore more problems and detailed explanations
The graph that represents Bob's motion is the fourth graph (with a slow - increasing segment, a flat segment, and then a steeper - increasing segment) as it shows walking (slow increase), stopping (flat), and running (steeper increase) in terms of distance from the starting point over time.