QUESTION IMAGE
Question
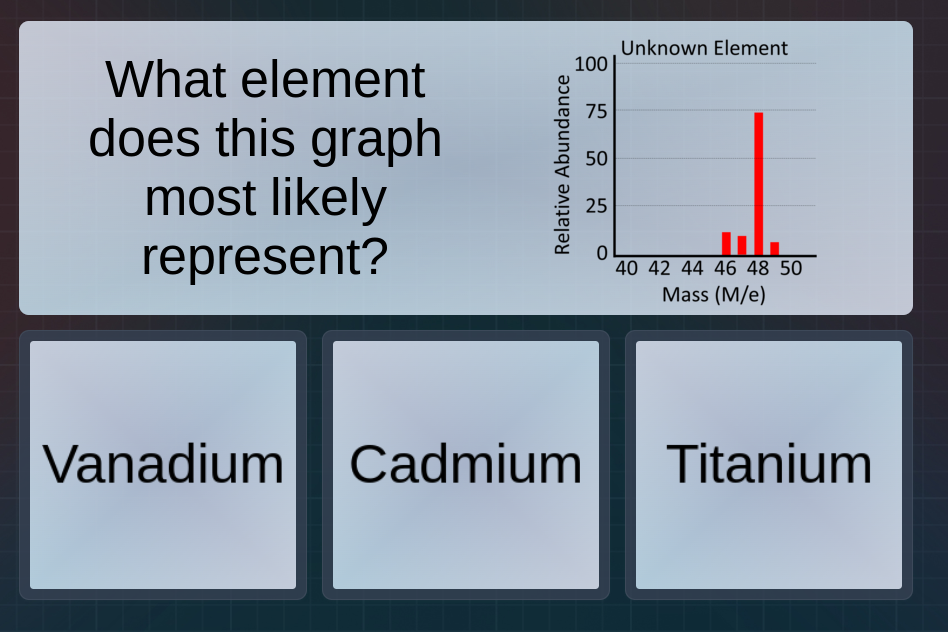
what element does this graph most likely represent?
unknown element
relative abundance
mass (m/e)
vanadium
cadmium
titanium
Brief Explanations
To determine the element, we analyze the mass spectrum. Titanium has isotopes with masses around 46, 47, 48, and 49 (with Ti - 48 being the most abundant, matching the tall peak at ~48 and smaller peaks at ~46, ~47, etc.). Vanadium's isotopes are around 50, 51 (not matching the graph's mass range focus). Cadmium's isotopes are much higher (e.g., 106 - 116), so it doesn't fit. Thus, the graph most likely represents Titanium.

Snap & solve any problem in the app
Get step-by-step solutions on Sovi AI
Photo-based solutions with guided steps
Explore more problems and detailed explanations
Titanium