QUESTION IMAGE
Question
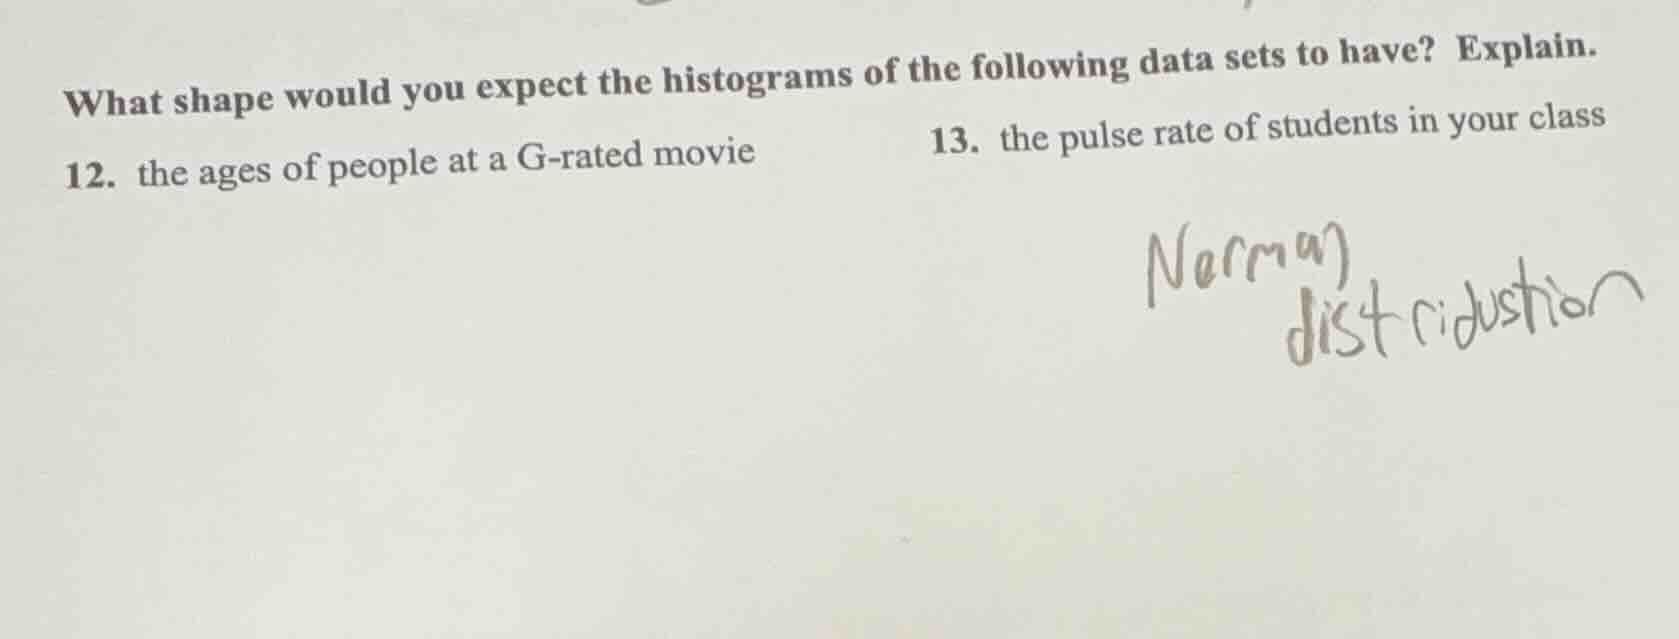
what shape would you expect the histograms of the following data sets to have? explain.
- the ages of people at a g-rated movie
- the pulse rate of students in your class
normal distribution
Brief Explanations
- For G-rated movie ages: G-rated films attract young children, their parents/guardians, and some older adults. This creates two distinct groups of high frequency (young kids and adult caregivers) with fewer people in middle age ranges, leading to a bimodal shape.
- For student pulse rates: Most healthy students will have pulse rates clustered around a central average, with fewer students having extremely low or high pulse rates, matching a normal (symmetric, bell) distribution.

Snap & solve any problem in the app
Get step-by-step solutions on Sovi AI
Photo-based solutions with guided steps
Explore more problems and detailed explanations
- The histogram will be bimodal (two peaks). Explanation: G-rated movies draw young children and their adult caregivers, creating two large age groups with a smaller number of people in between.
- The histogram will be approximately normal (symmetric, bell-shaped). Explanation: Healthy student pulse rates cluster around a typical average, with fewer students having very low or very high pulse rates.