QUESTION IMAGE
Question
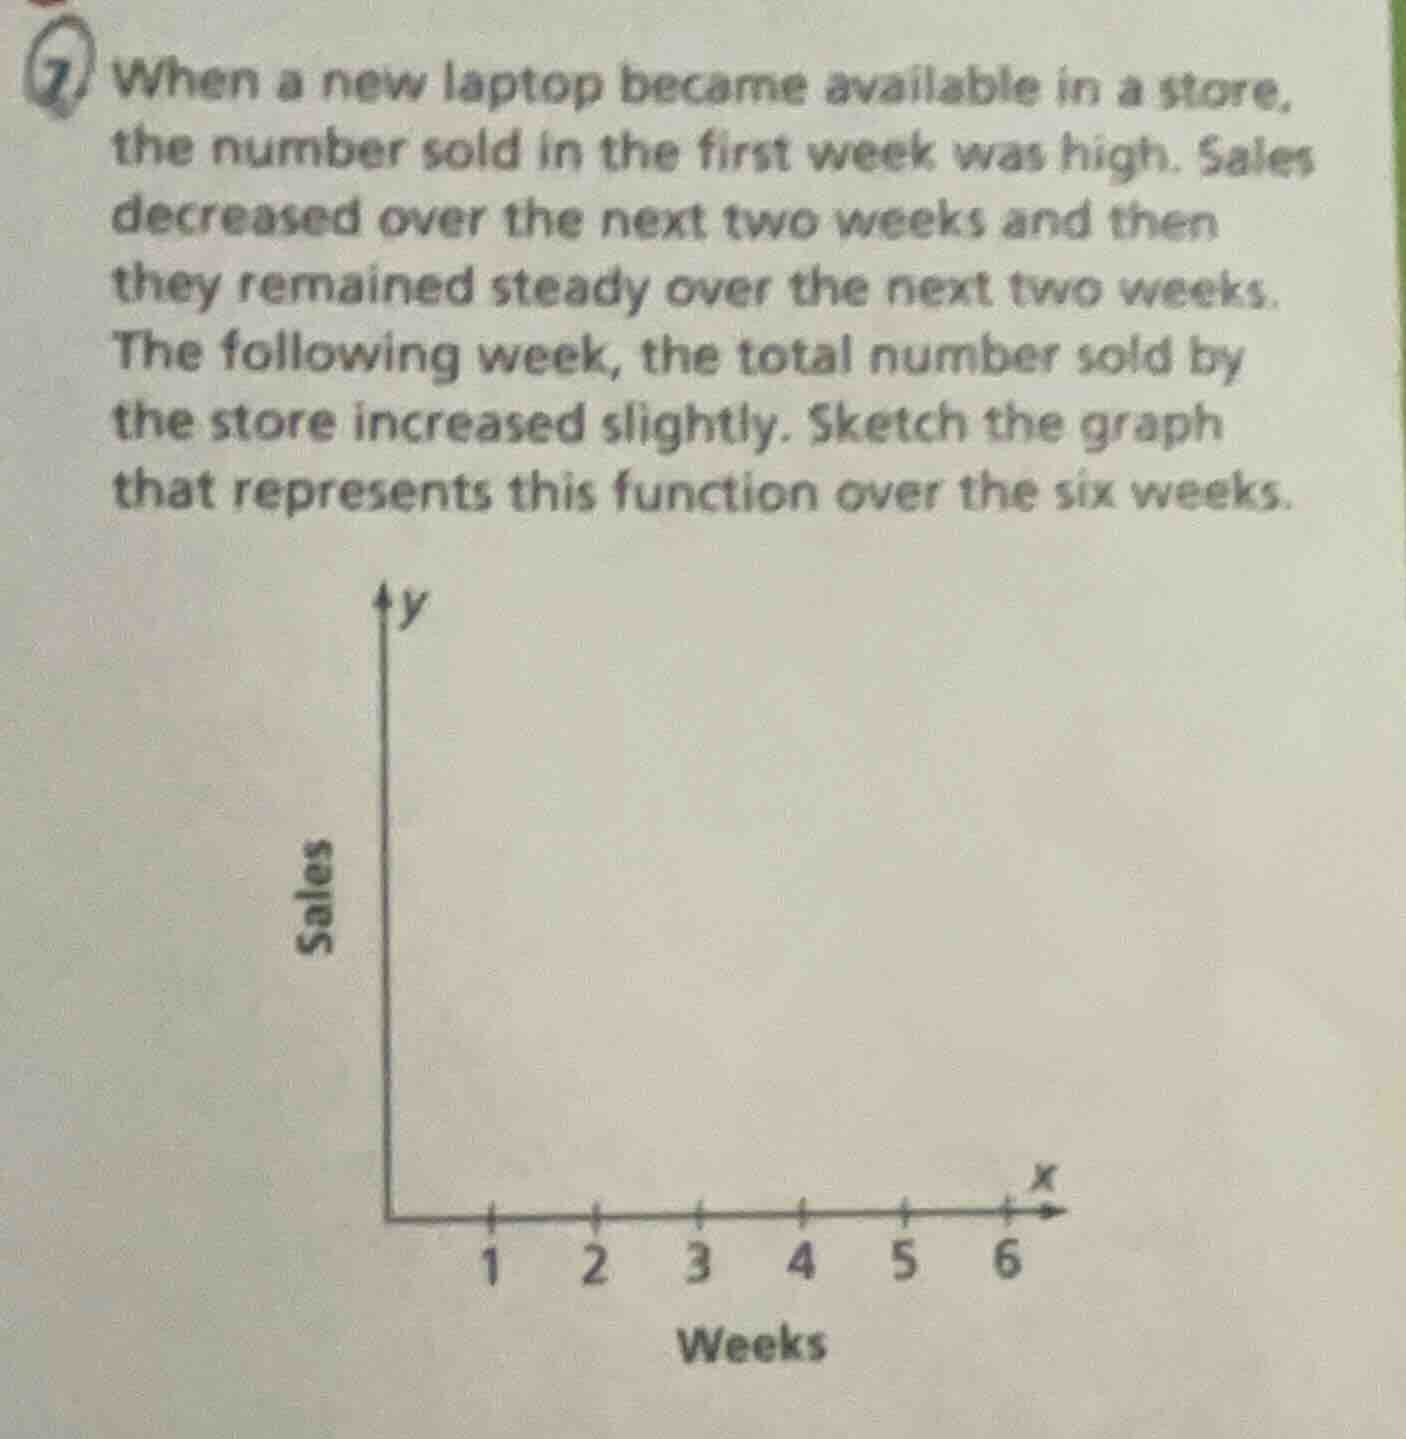
when a new laptop became available in a store, the number sold in the first week was high. sales decreased over the next two weeks and then they remained steady over the next two weeks. the following week, the total number sold by the store increased slightly. sketch the graph that represents this function over the six weeks.
Step1: Analyze Week 1
In the first week, sales are high. So we start with a point on the graph at \( x = 1 \) (week 1) with a relatively high \( y \)-value (sales).
Step2: Analyze Weeks 2 - 3
Sales decrease over the next two weeks (weeks 2 and 3). So from \( x = 1 \) to \( x = 3 \), the graph should be a line with a negative slope (going downwards) as the sales are decreasing.
Step3: Analyze Weeks 4 - 5
Sales remain steady over the next two weeks (weeks 4 and 5). This means the graph from \( x = 3 \) to \( x = 5 \) should be a horizontal line (slope = 0) since the sales value is constant.
Step4: Analyze Week 6
In the sixth week, sales increase slightly. So from \( x = 5 \) to \( x = 6 \), the graph should be a line with a small positive slope (going upwards a bit) as the sales increase slightly.
To sketch the graph:
- Plot the \( x \)-axis as "Weeks" from 1 to 6 and the \( y \)-axis as "Sales".
- Start at a high point for week 1.
- Draw a line decreasing from week 1 to week 3.
- Draw a horizontal line from week 3 to week 5.
- Draw a line with a small positive slope from week 5 to week 6.

Snap & solve any problem in the app
Get step-by-step solutions on Sovi AI
Photo-based solutions with guided steps
Explore more problems and detailed explanations
The graph will have the following features:
- A point at (1, high sales) initially.
- A decreasing line from (1, high) to (3, lower sales).
- A horizontal line from (3, lower) to (5, same as at 3).
- A slightly increasing line from (5, same as at 3) to (6, slightly higher than at 3).
(Note: Since it's a sketch, the exact coordinates are relative, but the shape follows the described trends: high at week 1, decreasing until week 3, constant until week 5, slightly increasing at week 6.)