QUESTION IMAGE
Question
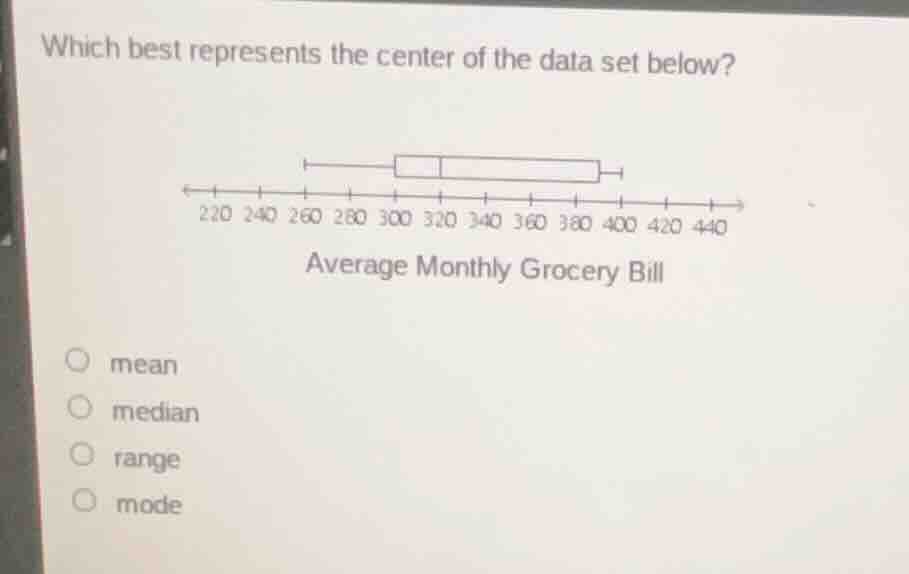
which best represents the center of the data set below? average monthly grocery bill 220 240 260 280 300 320 340 360 380 400 420 440 mean median range mode
Brief Explanations
To determine the center of a data set represented by a box - plot (the given graph is a box - plot for average monthly grocery bill), we analyze each option:
- Mean: The mean is affected by extreme values. If the data has outliers, the mean will be pulled in the direction of the outliers and may not represent the center well.
- Median: The median is the middle value of a data set when it is ordered from least to greatest. In a box - plot, the line inside the box (the median line) represents the median of the data. The median is a resistant measure of center, meaning it is not affected by extreme values. For a data set that may have skewness (which can be inferred from the box - plot's shape), the median is a good representation of the center.
- Range: The range is a measure of spread (it is calculated as the difference between the maximum and minimum values, \( \text{Range}=\text{Max}-\text{Min} \)), not a measure of center.
- Mode: The mode is the most frequently occurring value in a data set. For a continuous - like data set (such as grocery bills which can take on a wide range of values), the mode may not be a meaningful or well - defined measure of center, and it also does not represent the "middle" of the data set.

Snap & solve any problem in the app
Get step-by-step solutions on Sovi AI
Photo-based solutions with guided steps
Explore more problems and detailed explanations
B. median