QUESTION IMAGE
Question
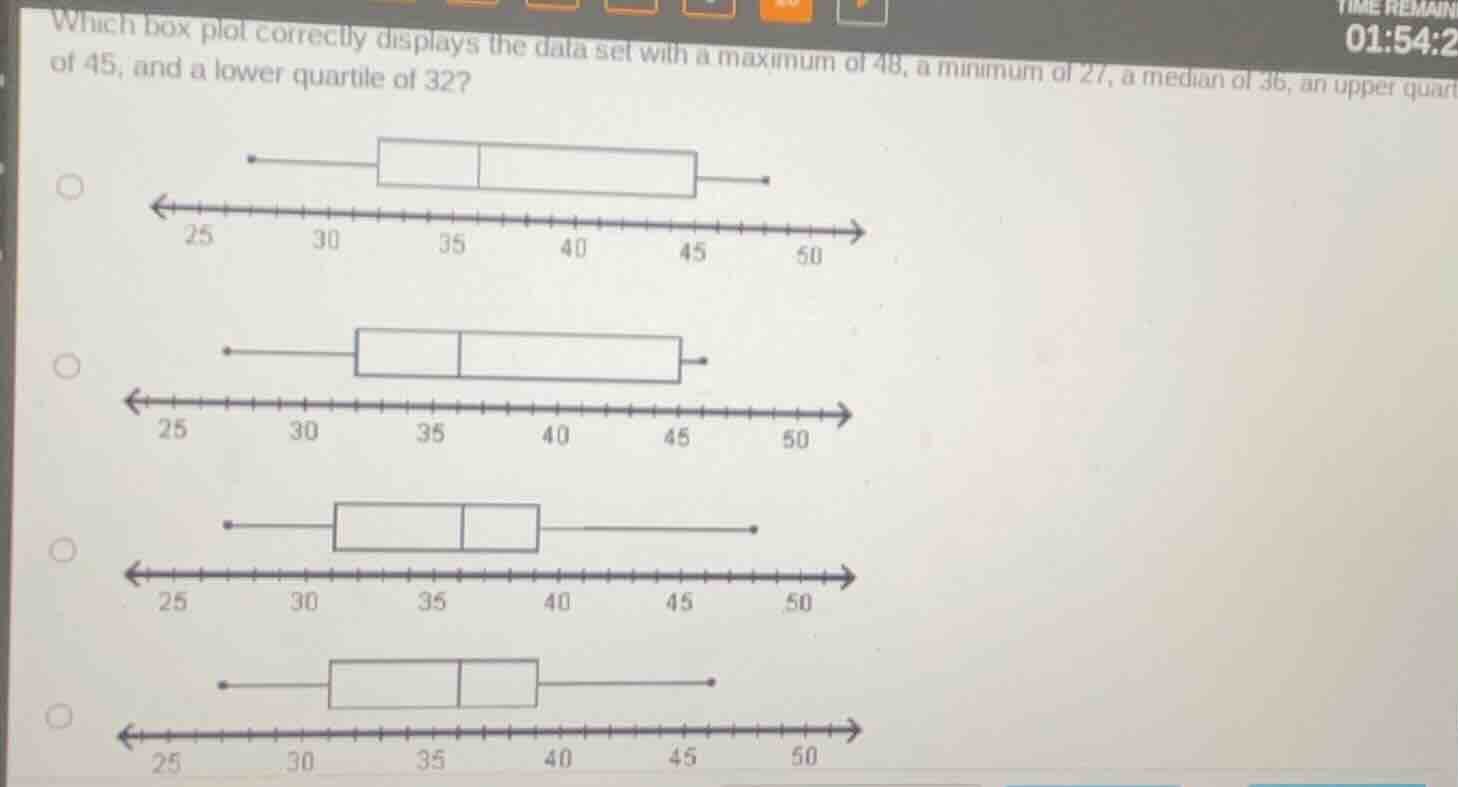
which box plot correctly displays the data set with a maximum of 48, a minimum of 27, a median of 36, an upper quartile of 45, and a lower quartile of 32?
Step1: Recall box plot components
A box plot has: left whisker at minimum (27), left box edge at lower quartile (32), box line at median (36), right box edge at upper quartile (45), right whisker at maximum (48).
Step2: Match values to each plot
- First plot: Min=27, Q1=32, Median=36, Q3=45, Max=48. This matches all given values.
- Second plot: Max ends at 45 (does not match 48).
- Third plot: Q3=40, Max=50 (does not match 45, 48).
- Fourth plot: Q3=40, Max=48 (does not match 45).

Snap & solve any problem in the app
Get step-by-step solutions on Sovi AI
Photo-based solutions with guided steps
Explore more problems and detailed explanations
The first (topmost) box plot, with whiskers at 27 and 48, box edges at 32 and 45, and median line at 36.