QUESTION IMAGE
Question
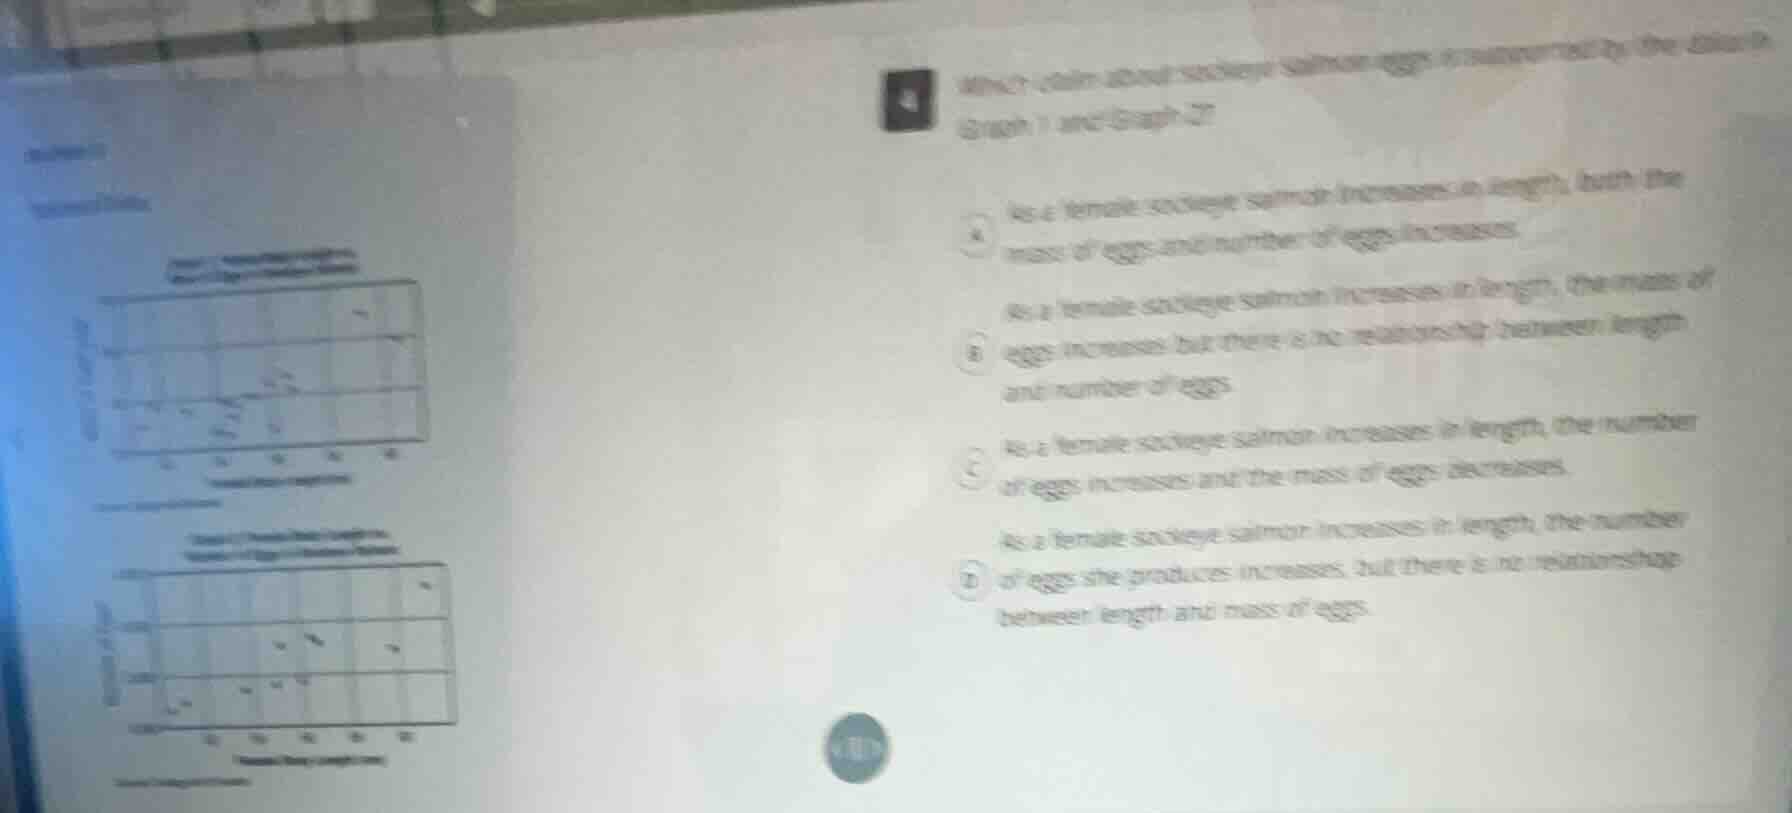
4 which claim about sockeye salmon eggs is supported by the data in graph 1 and graph 2? a as a female sockeye salmon increases in length, both the mass of eggs and number of eggs increases. b as a female sockeye salmon increases in length, the mass of eggs increases but there is no relationship between length and number of eggs. c as a female sockeye salmon increases in length, the number of eggs increases and the mass of eggs decreases. d as a female sockeye salmon increases in length, the number of eggs she produces increases, but there is no relationship between length and mass of eggs.
- Analyze Graph 1 (Female Length vs. Egg Mass): As the x-axis (female length) increases, the y-axis (egg mass) shows an upward trend, meaning egg mass increases with female length.
- Analyze Graph 2 (Female Length vs. Number of Eggs): As the x-axis (female length) increases, the y-axis (number of eggs) shows an upward trend, meaning the number of eggs increases with female length.
- Match this observation to the options: Only option A states both egg mass and number of eggs increase as female length increases.

Snap & solve any problem in the app
Get step-by-step solutions on Sovi AI
Photo-based solutions with guided steps
Explore more problems and detailed explanations
A. As a female sockeye salmon increases in length, both the mass of eggs and number of eggs increases.