QUESTION IMAGE
Question
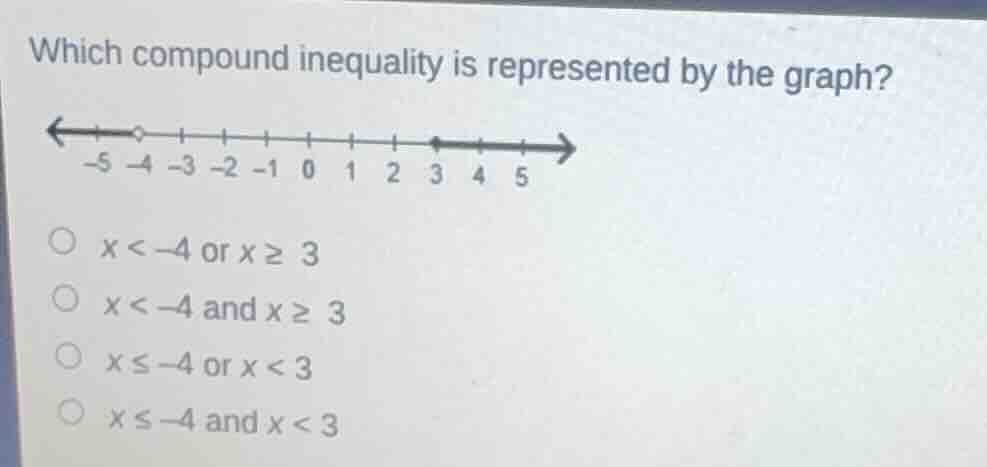
which compound inequality is represented by the graph? -5 -4 -3 -2 -1 0 1 2 3 4 5 x < -4 or x ≥ 3 x < -4 and x ≥ 3 x ≤ -4 or x < 3 x ≤ -4 and x < 3
Step1: Analyze the left part of the graph
The left part of the graph has an open circle at -4 and an arrow pointing to the left, which means \( x < -4 \).
Step2: Analyze the right part of the graph
The right part of the graph has a closed circle at 3 and an arrow pointing to the right, which means \( x \geq 3 \).
Step3: Determine the compound inequality
Since the two parts of the graph are separate (one for \( x < -4 \) and one for \( x \geq 3 \)), the compound inequality is "or" because a number can't be both less than -4 and greater than or equal to 3 at the same time. So the compound inequality is \( x < -4 \) or \( x \geq 3 \).

Snap & solve any problem in the app
Get step-by-step solutions on Sovi AI
Photo-based solutions with guided steps
Explore more problems and detailed explanations
A. \( x < -4 \) or \( x \geq 3 \)