QUESTION IMAGE
Question
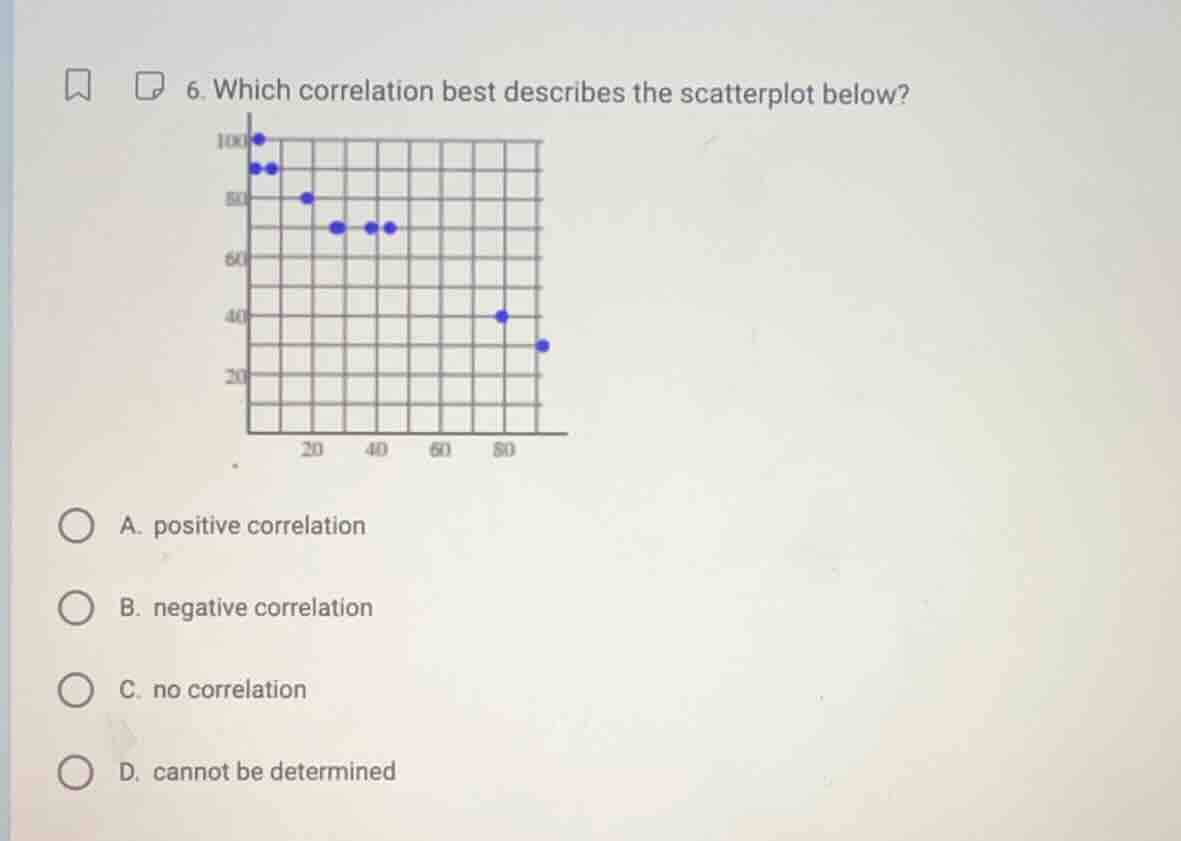
- which correlation best describes the scatterplot below? a. positive correlation b. negative correlation c. no correlation d. cannot be determined
Brief Explanations
To determine the correlation, we analyze the scatterplot's trend. A negative correlation occurs when as one variable (x - axis) increases, the other (y - axis) decreases. In the given scatterplot, as the x - value (horizontal axis) increases, the y - value (vertical axis) generally decreases. A positive correlation would have both variables increasing together, and no correlation would have points scattered randomly with no clear trend. Here, the trend of decreasing y with increasing x indicates a negative correlation.

Snap & solve any problem in the app
Get step-by-step solutions on Sovi AI
Photo-based solutions with guided steps
Explore more problems and detailed explanations
B. negative correlation