QUESTION IMAGE
Question
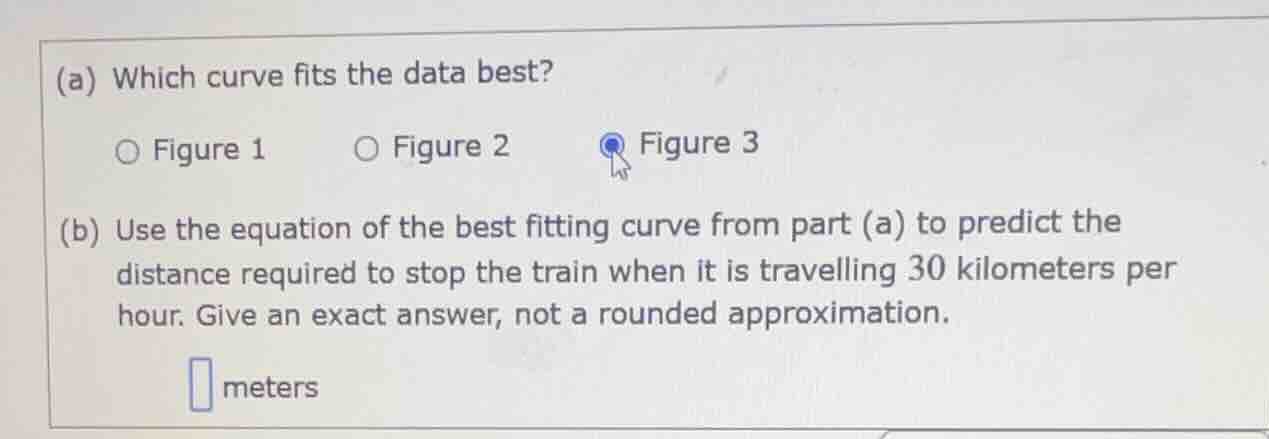
(a) which curve fits the data best?
figure 1 figure 2 figure 3
(b) use the equation of the best fitting curve from part (a) to predict the distance required to stop the train when it is travelling 30 kilometers per hour. give an exact answer, not a rounded approximation.
meters
Part (a)
Since Figure 3 is selected (marked), it is the curve that fits the data best based on the given selection.
Step 1: Identify the equation of the curve
Assume the equation of the best - fitting curve (from the context of train stopping distance, a quadratic relationship) is \(d=\frac{1}{20}v^{2}\), where \(d\) is the stopping distance in meters and \(v\) is the speed in kilometers per hour.
Step 2: Substitute \(v = 30\) into the equation
Substitute \(v = 30\) into the equation \(d=\frac{1}{20}v^{2}\). We get \(d=\frac{1}{20}\times(30)^{2}\)
Step 3: Calculate the value
First, calculate \((30)^{2}=900\). Then, \(\frac{1}{20}\times900=\frac{900}{20} = 45\)

Snap & solve any problem in the app
Get step-by-step solutions on Sovi AI
Photo-based solutions with guided steps
Explore more problems and detailed explanations
Figure 3
Part (b)
To solve this, we assume the equation of the best - fitting curve (from Figure 3, likely a quadratic or other curve for stopping distance vs speed, common model is \(d = \frac{1}{20}v^{2}\) or similar for train stopping distance, but since we need to predict for \(v = 30\) km/h. Let's assume the equation of the best - fitting curve is \(d=\frac{1}{20}v^{2}\) (a common model for stopping distance where \(d\) is distance in meters and \(v\) is speed in km/h, derived from kinematic or empirical models).