QUESTION IMAGE
Question
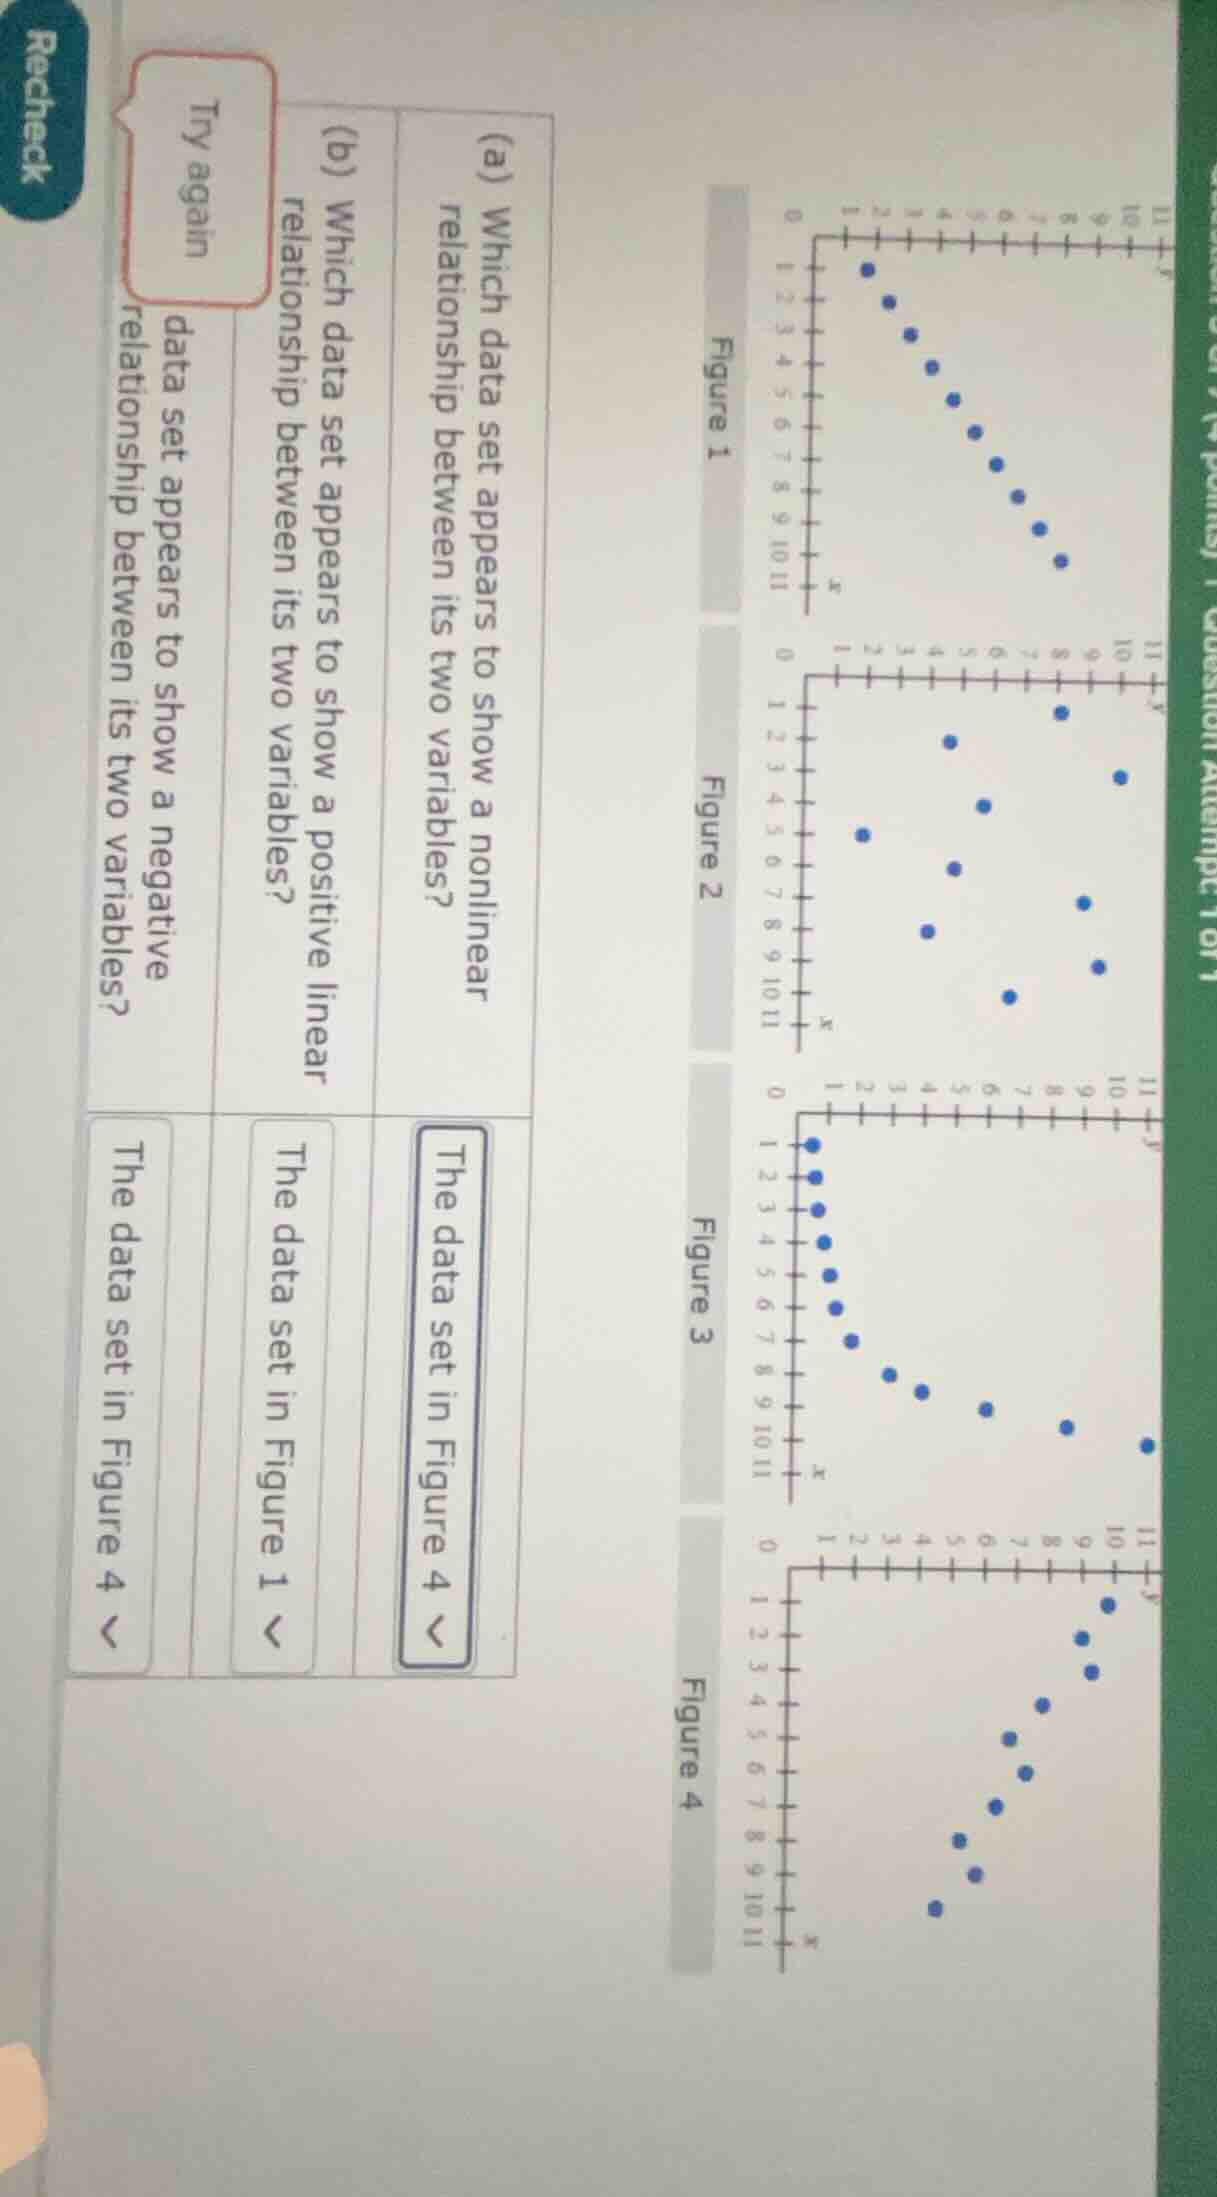
(a) which data set appears to show a nonlinear relationship between its two variables? the data set in figure 4 (b) which data set appears to show a positive linear relationship between its two variables? the data set in figure 1 which data set appears to show a negative relationship between its two variables? the data set in figure 4
Part (a)
To determine a nonlinear relationship, we analyze the scatter plots:
- Figure 1: Points form a curve (non - linear? Wait, no, let's re - check. Wait, Figure 4: The data points in Figure 4 form a curve (like a U - shape or some non - straight pattern), while Figure 1 has a curve that is more like a quadratic? Wait, no, the key is that a nonlinear relationship is when the points don't lie close to a straight line. Figure 4's points form a curve (e.g., a parabola - like shape), so it's nonlinear.
For a positive linear relationship, as one variable (x) increases, the other (y) should increase in a straight - line - like pattern. In Figure 1, as x increases, y first decreases and then increases? Wait, no, wait the axes: Wait, looking at Figure 1, maybe I misread. Wait, no, let's check again. Wait, the correct one: A positive linear relationship has points that trend upward in a straight - line fashion. Wait, maybe Figure 1: No, wait the original problem's option says Figure 1. Wait, maybe in Figure 1, the points form a curve that is increasing in a way? Wait, no, maybe the intended is that Figure 1 has a positive linear? Wait, no, let's think again. A positive linear relationship is when x and y have a direct linear correlation (as x increases, y increases in a straight line). Wait, maybe the data in Figure 1: Wait, the option given is Figure 1. So the data set in Figure 1 shows a positive linear relationship? Wait, no, maybe I made a mistake. Wait, the problem's option for (b) is Figure 1. So we go with that.
A negative relationship is when as x increases, y decreases. Looking at the figures, the data set in Figure 3 (wait, no, the option is Figure 4? Wait, no, the original problem's option for the negative relationship is Figure 4? Wait, no, let's check. Wait, the third sub - question: "Which data set appears to show a negative relationship between its two variables?". Wait, the option is "The data set in Figure 4"? No, wait, maybe Figure 3. But the problem's option is Figure 4? Wait, no, the user's problem has the option as "The data set in Figure 4". Wait, maybe I misread the figures. But according to the problem's given options, the answer is:

Snap & solve any problem in the app
Get step-by-step solutions on Sovi AI
Photo-based solutions with guided steps
Explore more problems and detailed explanations
The data set in Figure 4