QUESTION IMAGE
Question
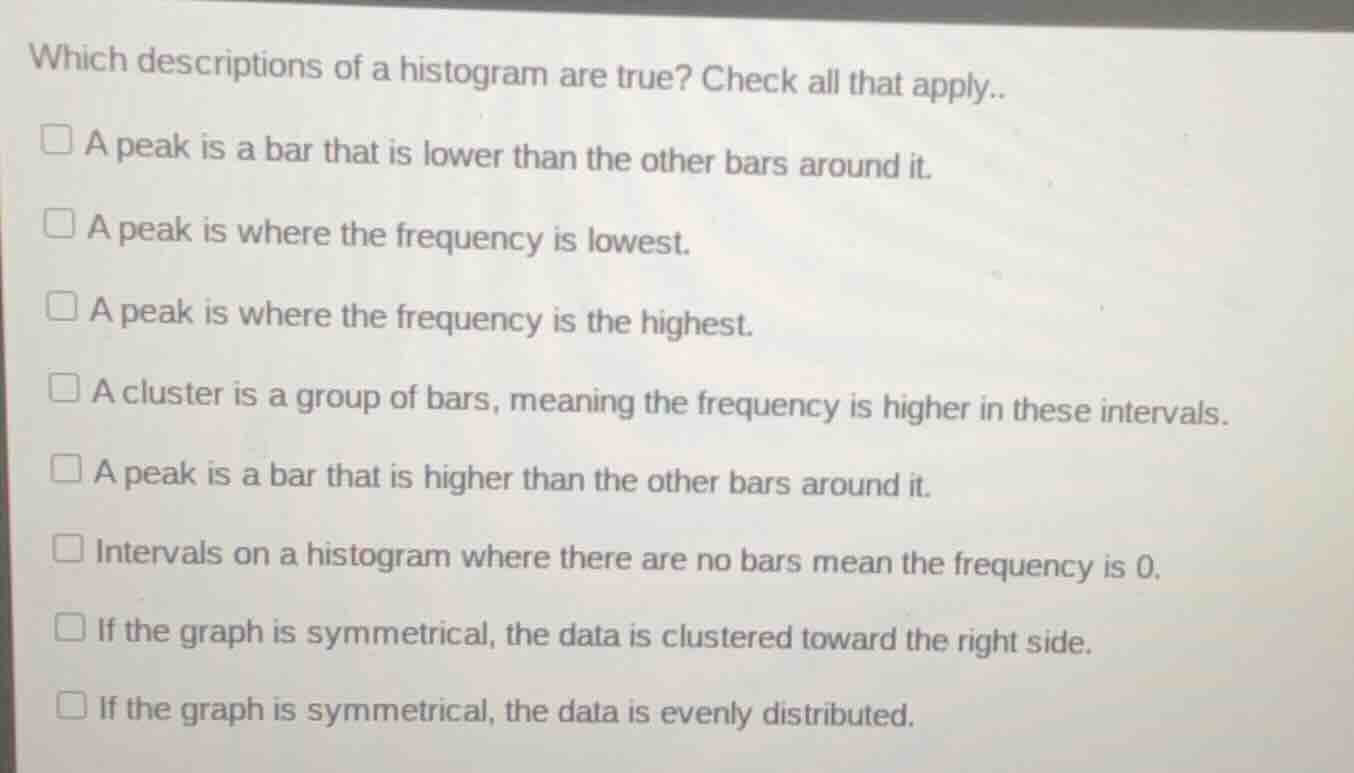
which descriptions of a histogram are true? check all that apply..
□ a peak is a bar that is lower than the other bars around it.
□ a peak is where the frequency is lowest.
□ a peak is where the frequency is the highest.
□ a cluster is a group of bars, meaning the frequency is higher in these intervals.
□ a peak is a bar that is higher than the other bars around it.
□ intervals on a histogram where there are no bars mean the frequency is 0.
□ if the graph is symmetrical, the data is clustered toward the right side.
□ if the graph is symmetrical, the data is evenly distributed.
- A peak in a histogram refers to the bar (or interval) with the highest frequency, so it is taller than surrounding bars.
- A cluster is a group of adjacent bars with relatively high frequency compared to other intervals.
- Empty intervals (no bars) mean there are no data points in that range, so frequency is 0.
- Symmetrical histograms have data evenly distributed around the center, not clustered to one side.

Snap & solve any problem in the app
Get step-by-step solutions on Sovi AI
Photo-based solutions with guided steps
Explore more problems and detailed explanations
C. A peak is where the frequency is the highest.
D. A cluster is a group of bars, meaning the frequency is higher in these intervals.
E. A peak is a bar that is higher than the other bars around it.
F. Intervals on a histogram where there are no bars mean the frequency is 0.
H. If the graph is symmetrical, the data is evenly distributed.