QUESTION IMAGE
Question
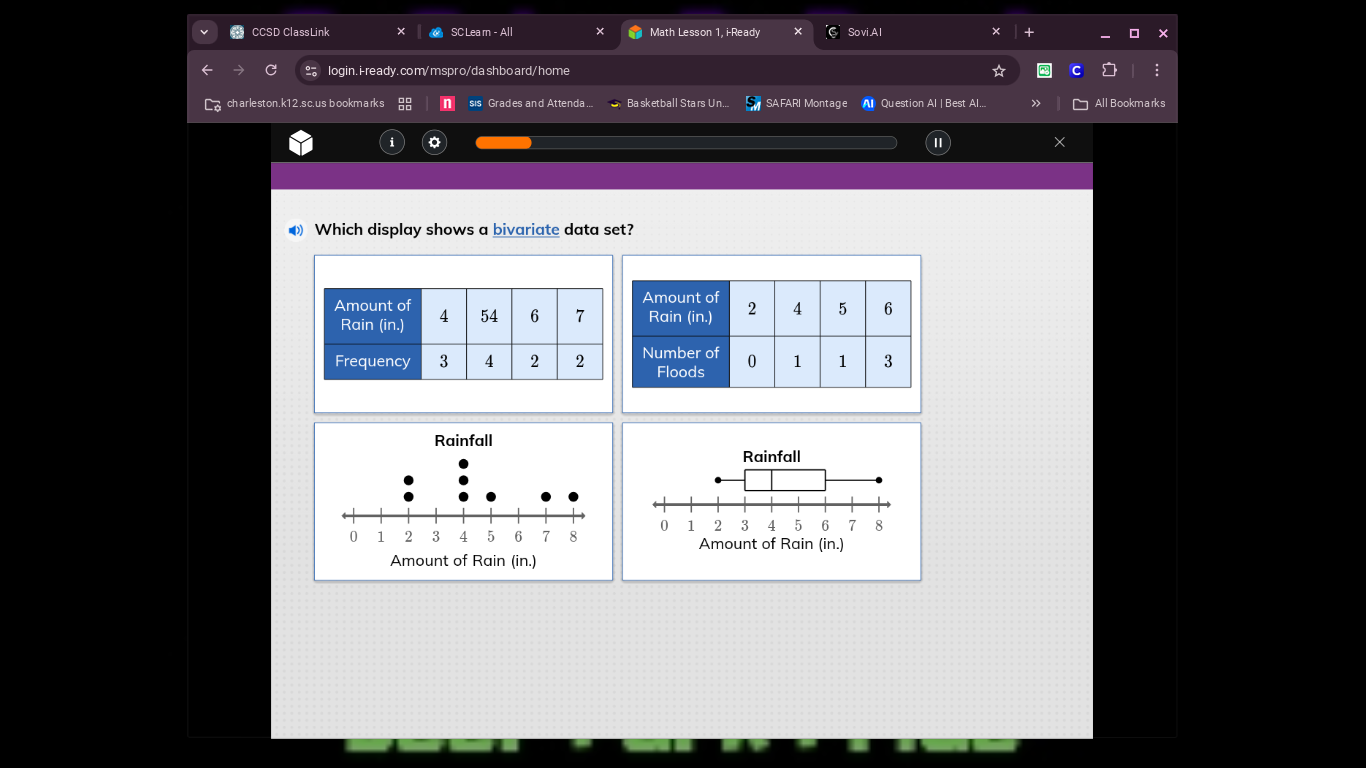
which display shows a bivariate data set?
(the tables and graphs related to rainfall and floods are omitted here as per the ocr text processing rule)
Step1: Recall bivariate data definition
Bivariate data involves two variables. We check each display:
- Top - left: Variables "Amount of Rain" and "Frequency" (univariate? No, wait, "Amount of Rain" is one variable, "Frequency" is count. Wait, no, let's check others.
- Top - right: Variables "Amount of Rain" and "Number of Floods" (two variables, so bivariate).
- Bottom - left: Dot plot of "Amount of Rain" (one variable, univariate).
- Bottom - right: Box plot of "Amount of Rain" (one variable, univariate).
- Top - left: "Amount of Rain" (values) and "Frequency" (count of each rain amount) – but frequency is related to one variable (rain amount), so univariate. Top - right has two distinct variables (rain and floods), so bivariate.
Step2: Identify the bivariate display
The top - right table (with "Amount of Rain (in.)" and "Number of Floods") shows two variables, so it's bivariate. The other displays show only one variable (rain amount) with frequency, dot plot, or box plot.

Snap & solve any problem in the app
Get step-by-step solutions on Sovi AI
Photo-based solutions with guided steps
Explore more problems and detailed explanations
The table with columns "Amount of Rain (in.)" and "Number of Floods" (top - right display)