QUESTION IMAGE
Question
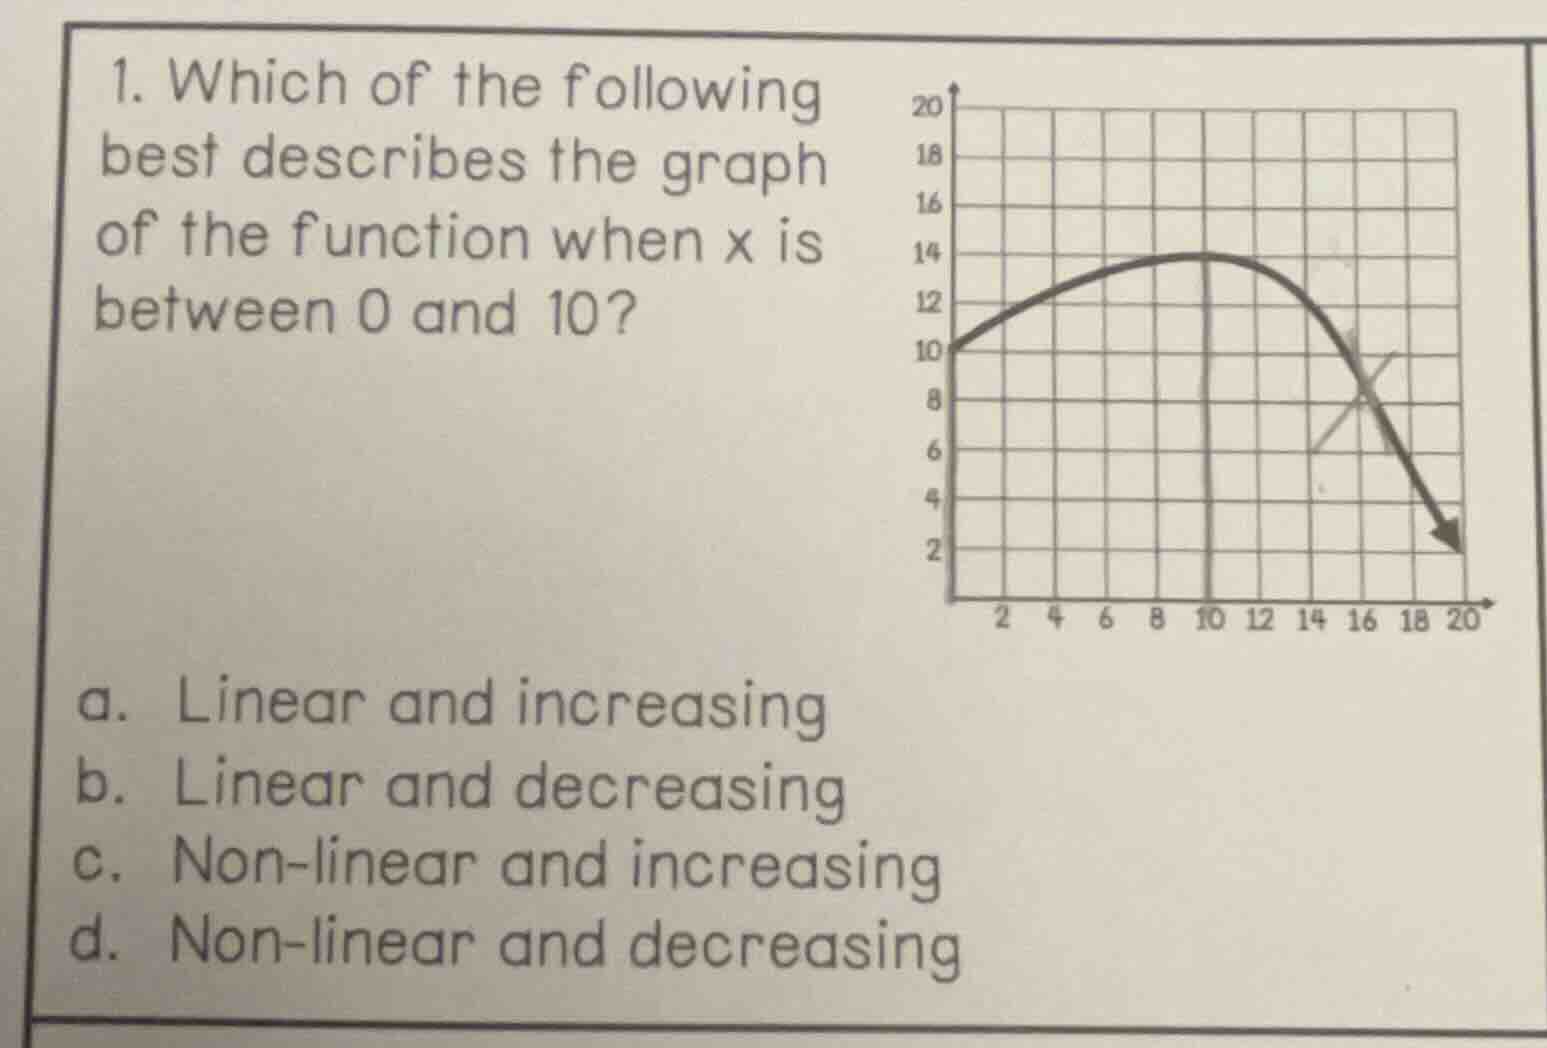
- which of the following best describes the graph of the function when x is between 0 and 10?
a. linear and increasing
b. linear and decreasing
c. non-linear and increasing
d. non-linear and decreasing
Brief Explanations
- First, check if the graph is linear or non-linear between x=0 and x=10: A linear graph forms a straight line, but this graph is a curved parabola, so it is non-linear.
- Next, check if it is increasing or decreasing between x=0 and x=10: As x increases from 0 to 10, the y-values rise from 10 to 14, so the function is increasing in this interval.

Snap & solve any problem in the app
Get step-by-step solutions on Sovi AI
Photo-based solutions with guided steps
Explore more problems and detailed explanations
c. Non-linear and increasing