QUESTION IMAGE
Question
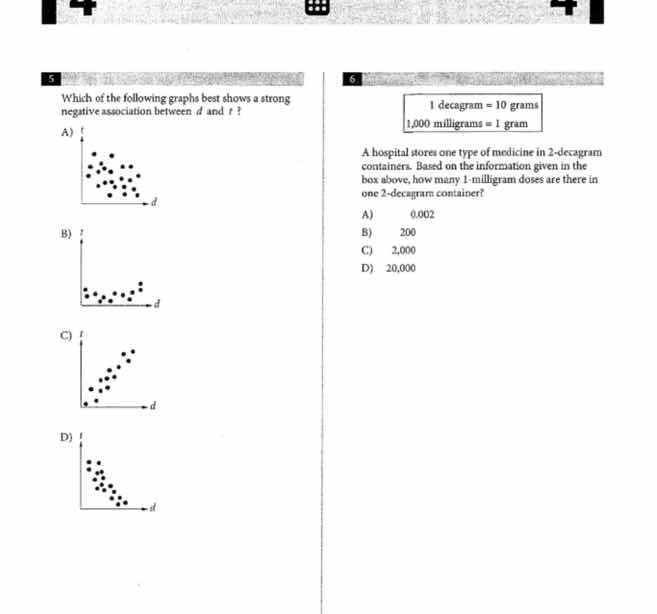
5 which of the following graphs best shows a strong negative association between ( d ) and ( t )? a) scatter plot with points showing a weak negative trend b) scatter plot with points showing no clear trend or a positive trend c) scatter plot with points showing a strong positive trend d) scatter plot with points showing a strong negative trend 6 box with text: 1 decagram = 10 grams; 1,000 milligrams = 1 gram a hospital stores one type of medicine in 2 - decagram containers. based on the information given in the box above, how many 1 - milligram doses are there in one 2 - decagram container? a) 0.002 b) 200 c) 2,000 d) 20,000
Question 5
Step1: Understand negative association
A strong negative association between \( d \) and \( t \) means as \( d \) increases, \( t \) decreases, and the points are close to a line (strong).
Step2: Analyze each graph
- Option A: Points are scattered, no strong trend. Eliminate.
- Option B: As \( d \) increases, \( t \) increases (positive association). Eliminate.
- Option C: As \( d \) increases, \( t \) increases (positive association). Eliminate.
- Option D: As \( d \) increases, \( t \) decreases, and points are close (strong negative). Correct.
Step1: Convert decagrams to grams
Given \( 1 \) decagram \( = 10 \) grams, so \( 2 \) decagrams \( = 2 \times 10 = 20 \) grams.
Step2: Convert grams to milligrams
Given \( 1000 \) milligrams \( = 1 \) gram, so \( 20 \) grams \( = 20 \times 1000 = 20000 \) milligrams.

Snap & solve any problem in the app
Get step-by-step solutions on Sovi AI
Photo-based solutions with guided steps
Explore more problems and detailed explanations
D