QUESTION IMAGE
Question
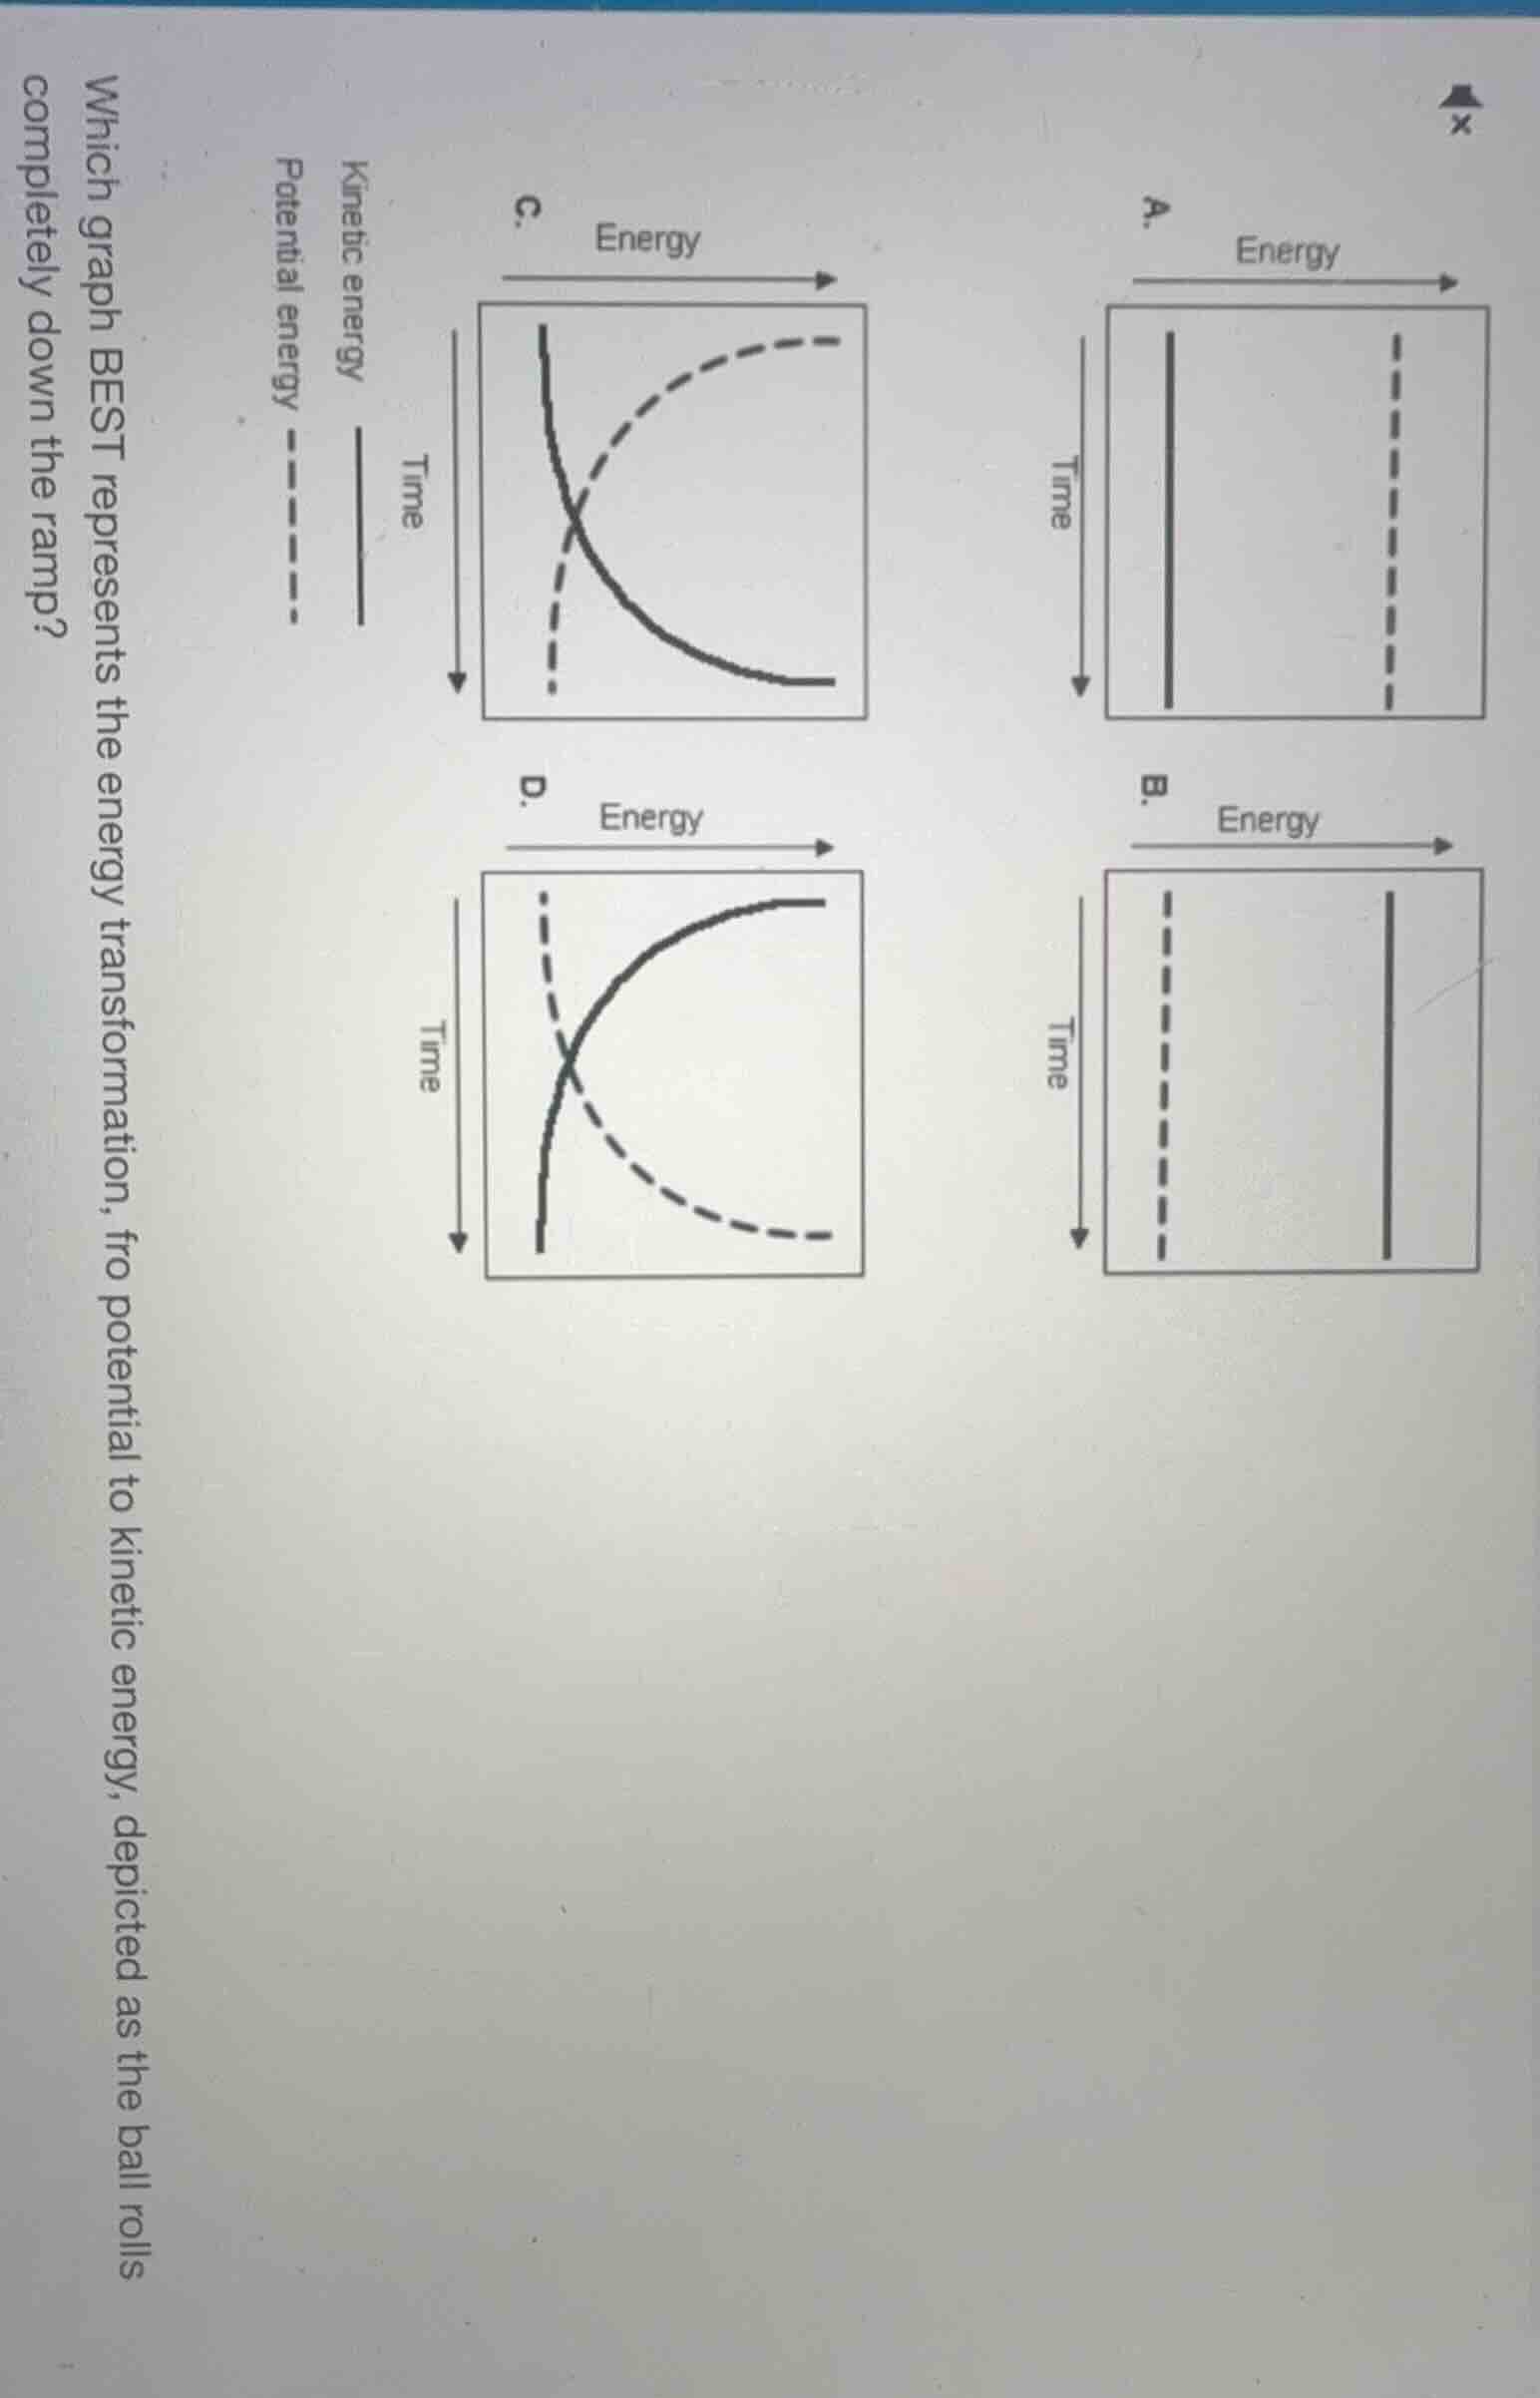
which graph best represents the energy transformation, fro potential to kinetic energy, depicted as the ball rolls completely down the ramp?
kinetic energy ——
potential energy ------
a.
energy
time
b.
energy
time
c.
energy
time
d.
energy
time
When a ball rolls down a ramp, its gravitational potential energy (dashed line) decreases over time as it loses height, while its kinetic energy (solid line) increases as it gains speed. The energy transfer follows this inverse relationship, with potential energy approaching zero and kinetic energy approaching a maximum (constant value once at the bottom of the ramp). Graph C matches this: the solid line (kinetic energy) starts high, decreases? No, correction: Wait, no—wait, the key: at the start (top of ramp), potential energy is maximum, kinetic energy is zero. As time passes (rolling down), potential energy drops, kinetic energy rises. Looking at the legend: dashed is potential, solid is kinetic. So at time=0, potential (dashed) is high, kinetic (solid) is low. Then potential falls, kinetic rises. Graph C: dashed starts low? No, wait Graph D: dashed (potential) starts high, falls; solid (kinetic) starts low, rises and levels off. Wait no, the question says "completely down the ramp": at the end, potential energy is minimal (near zero), kinetic energy is maximum (constant, since no acceleration at bottom). The correct graph is C? No, wait legend: Kinetic is solid, potential is dashed. At start (top of ramp), kinetic energy is 0 (solid line starts low), potential is high (dashed starts high). As time goes, kinetic increases, potential decreases. Graph C: solid starts high, falls; dashed starts low, rises. That's reversed. Oh, right! I mixed up. Graph D: solid (kinetic) starts low, rises to constant; dashed (potential) starts high, falls to low. Wait no, the question says "from potential to kinetic energy"—so potential converts to kinetic. So initial state: high potential, low kinetic. Final state: low potential, high kinetic. So the dashed line (potential) should decrease, solid (kinetic) should increase. That's Graph C? No, Graph C's solid line (kinetic) decreases, dashed (potential) increases. That's wrong. Wait Graph D: solid (kinetic) increases, dashed (potential) decreases. Yes! Wait no, the axis: time goes downward. Oh! The time axis points downward, so the top of the graph is initial time (start of rolling), bottom is final time (end of ramp). So for Graph C: top of graph (initial time): solid (kinetic) is high, dashed (potential) is low. Bottom (final time): solid is low, dashed is high. That's wrong. Graph D: top (initial): solid (kinetic) is low, dashed (potential) is high. Bottom (final): solid is high, dashed is low. That's correct. Wait no, the question says "completely down the ramp"—so at the end, potential energy is as low as possible, kinetic is as high as possible (constant, since it's moving at constant speed at the bottom). So Graph D shows kinetic (solid) increasing to a constant, potential (dashed) decreasing to a low value. Wait no, the legend: Kinetic energy is solid line, Potential is dashed. So when rolling down, kinetic energy increases, potential decreases. With time going downward (top is start, bottom is end), the solid line should go from low (top) to high (bottom), dashed from high (top) to low (bottom). That is Graph D? No, Graph D's solid line goes from low (top) to high (bottom), dashed from high (top) to low (bottom). Yes. Wait but wait Graph C: solid goes from high (top) to low (bottom), dashed from low (top) to high (bottom). That's the reverse, which would be rolling up a ramp. So the correct graph is D? No, wait no, let's recheck the axis labels: Time arrow points downward, so as we move down the graph, time increases. So initial state (t=0) is the top of each graph, final state (t=end) is the…

Snap & solve any problem in the app
Get step-by-step solutions on Sovi AI
Photo-based solutions with guided steps
Explore more problems and detailed explanations
D. The graph where the solid line (kinetic energy) increases to a constant value and the dashed line (potential energy) decreases to a low value as time progresses downward