QUESTION IMAGE
Question
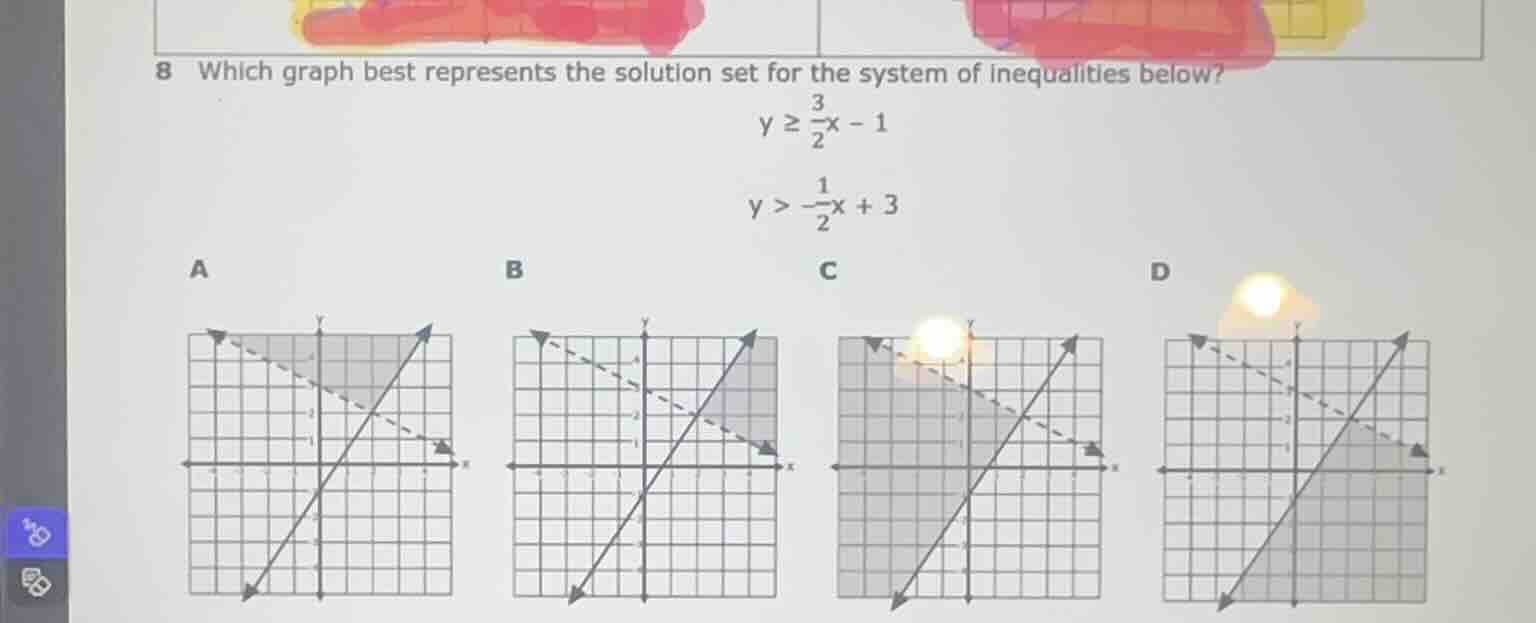
8 which graph best represents the solution set for the system of inequalities below?
$y \geq \frac{3}{2}x - 1$
$y > -\frac{1}{2}x + 3$
a
b
c
d
Step1: Analyze first inequality
The inequality is $y \geq \frac{3}{2}x - 1$.
- The boundary line is $y = \frac{3}{2}x - 1$, which has a slope of $\frac{3}{2}$ and y-intercept $-1$.
- The $\geq$ symbol means the boundary line is solid, and we shade the region above this line.
Step2: Analyze second inequality
The inequality is $y > -\frac{1}{2}x + 3$.
- The boundary line is $y = -\frac{1}{2}x + 3$, which has a slope of $-\frac{1}{2}$ and y-intercept $3$.
- The $>$ symbol means the boundary line is dashed, and we shade the region above this line.
Step3: Identify overlapping region
The solution set is the area that is shaded for both inequalities: above the solid line $y = \frac{3}{2}x - 1$ and above the dashed line $y = -\frac{1}{2}x + 3$. This matches the region in option A.

Snap & solve any problem in the app
Get step-by-step solutions on Sovi AI
Photo-based solutions with guided steps
Explore more problems and detailed explanations
A. <The graph with a solid line $y=\frac{3}{2}x-1$, dashed line $y=-\frac{1}{2}x+3$, and shaded region above both lines>