QUESTION IMAGE
Question
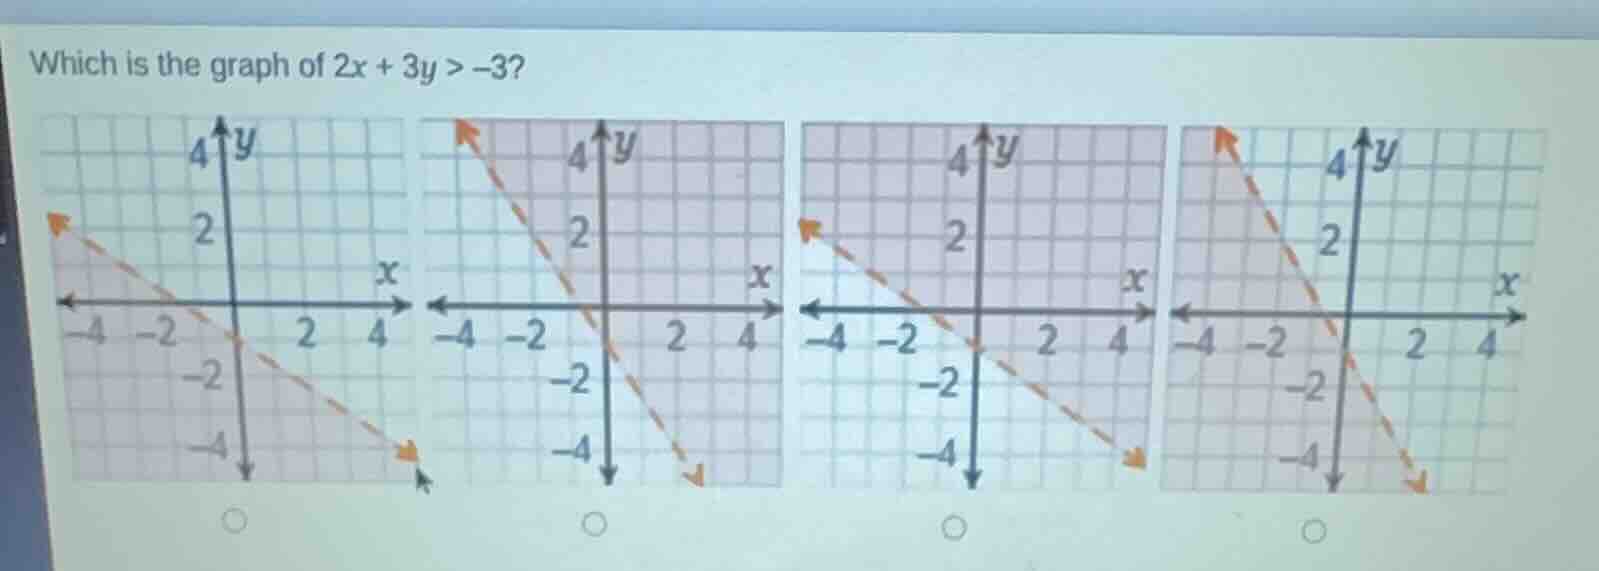
which is the graph of $2x + 3y > -3$? (four graphs with coordinate planes and dashed lines are shown, each with a shaded region and a circle for selection)
Step1: Rewrite the inequality in slope - intercept form
We start with the inequality \(2x + 3y>-3\). To get it in the form \(y = mx + b\) (slope - intercept form), we solve for \(y\).
Subtract \(2x\) from both sides: \(3y>- 2x - 3\).
Then divide each term by 3: \(y>-\frac{2}{3}x - 1\).
Step2: Analyze the boundary line
The boundary line for the inequality \(y>-\frac{2}{3}x - 1\) is the line \(y = -\frac{2}{3}x-1\). Since the inequality is \(y >\) (not \(y\geq\)), the boundary line should be dashed (to indicate that the points on the line are not included in the solution set).
The slope of the line \(y = -\frac{2}{3}x - 1\) is \(m=-\frac{2}{3}\) (negative slope, so the line goes down from left to right) and the y - intercept is \(b=- 1\) (the line crosses the y - axis at \((0,-1)\)).
Step3: Determine the region to shade
We test a point not on the line, usually the origin \((0,0)\), in the inequality \(y>-\frac{2}{3}x - 1\).
Substitute \(x = 0\) and \(y = 0\) into the inequality: \(0>-\frac{2}{3}(0)-1\), which simplifies to \(0 > - 1\). This is a true statement. So we shade the region that contains the origin \((0,0)\).
Now let's analyze the graphs:
- The slope of the line \(y = -\frac{2}{3}x-1\) has a negative slope and y - intercept at \((0, - 1)\). The graph with a dashed line (since the inequality is strict), negative slope, y - intercept at \((0,-1)\) and shading the region containing the origin (which is above the line \(y=-\frac{2}{3}x - 1\) when we consider the slope and intercept) is the third graph (the one where the dashed line has a slope of \(-\frac{2}{3}\), y - intercept at \((0,-1)\) and the shaded region includes the origin).

Snap & solve any problem in the app
Get step-by-step solutions on Sovi AI
Photo-based solutions with guided steps
Explore more problems and detailed explanations
The graph with the dashed line \(y = -\frac{2}{3}x-1\) (slope \(-\frac{2}{3}\), y - intercept \((0, - 1)\)) and shading the region containing the origin (the third graph among the four given graphs).