QUESTION IMAGE
Question
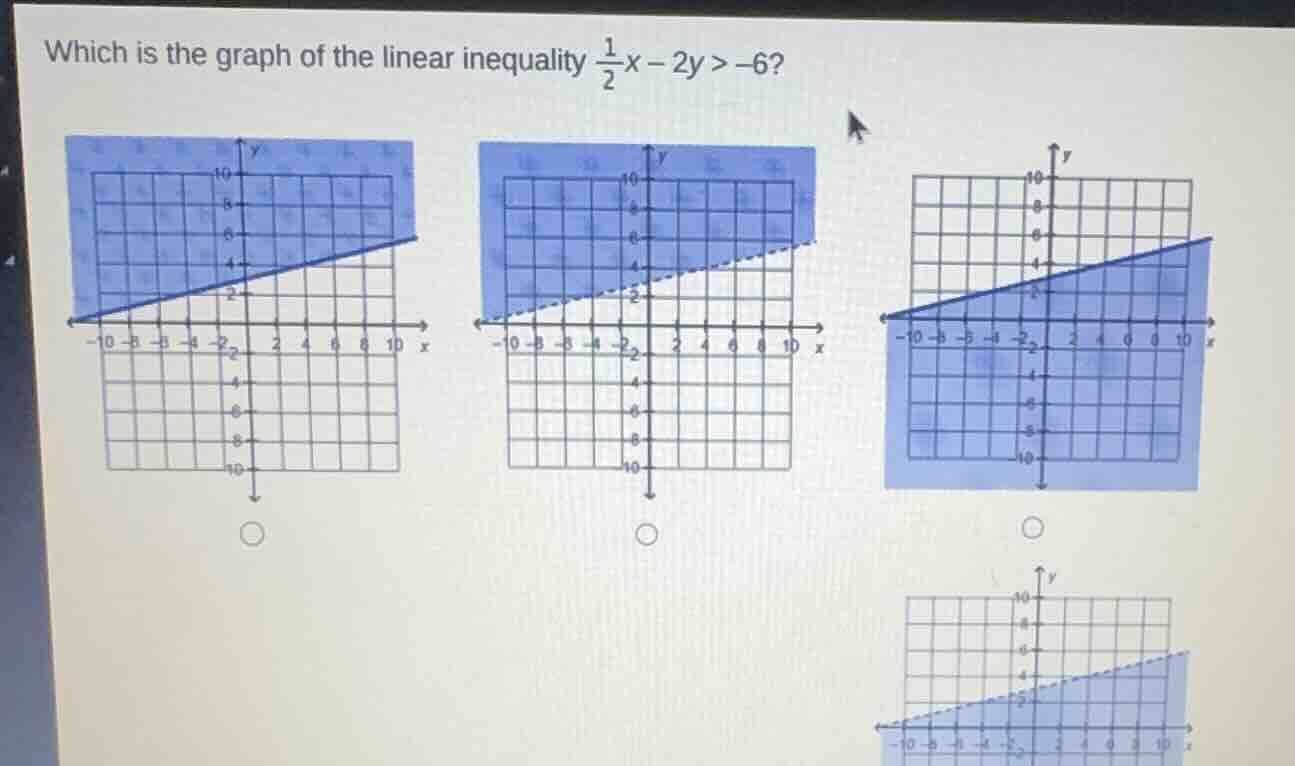
which is the graph of the linear inequality \\(\frac{1}{2}x - 2y > -6\\)?
Step1: Rewrite the inequality in slope - intercept form
We start with the inequality \(\frac{1}{2}x - 2y>-6\). First, we want to solve for \(y\).
Subtract \(\frac{1}{2}x\) from both sides: \(- 2y>-\frac{1}{2}x - 6\).
Then, divide each side by \(- 2\). Remember that when we divide or multiply an inequality by a negative number, the direction of the inequality sign changes. So we get \(y<\frac{1}{4}x + 3\).
Step2: Analyze the boundary line
The boundary line of the inequality \(y<\frac{1}{4}x + 3\) is the line \(y=\frac{1}{4}x+3\). Since the inequality is \(y <\frac{1}{4}x + 3\) (not \(y\leqslant\frac{1}{4}x + 3\)), the boundary line should be a dashed line (because the points on the line do not satisfy the inequality).
The slope of the line \(y=\frac{1}{4}x + 3\) is \(m = \frac{1}{4}\) and the \(y\) - intercept is \(b = 3\).
Step3: Determine the region to shade
We can test a point that is not on the line to see which region to shade. Let's test the point \((0,0)\). Substitute \(x = 0\) and \(y = 0\) into the inequality \(y<\frac{1}{4}x + 3\). We get \(0<\frac{1}{4}(0)+3\), which simplifies to \(0 < 3\), and this is true. So we shade the region that contains the point \((0,0)\).
Now, let's analyze the given graphs:
- The first graph has a solid line, which is incorrect because our boundary line should be dashed (since the inequality is strict, \(y<\cdots\)).
- The second graph: The boundary line is dashed (good), the slope of the line seems to match \(m=\frac{1}{4}\) (since for a run of 4, the rise is 1), the \(y\) - intercept is 3, and the region below the line (containing \((0,0)\)) is shaded.
- The third graph has a solid line, which is incorrect.
- The fourth graph: The \(y\) - intercept does not seem to be 3 (it looks like the \(y\) - intercept is 2 or something else), so it does not match our line \(y=\frac{1}{4}x + 3\).

Snap & solve any problem in the app
Get step-by-step solutions on Sovi AI
Photo-based solutions with guided steps
Explore more problems and detailed explanations
The second graph (the one with the dashed line, slope \(\frac{1}{4}\), \(y\) - intercept 3, and shading below the line)