QUESTION IMAGE
Question
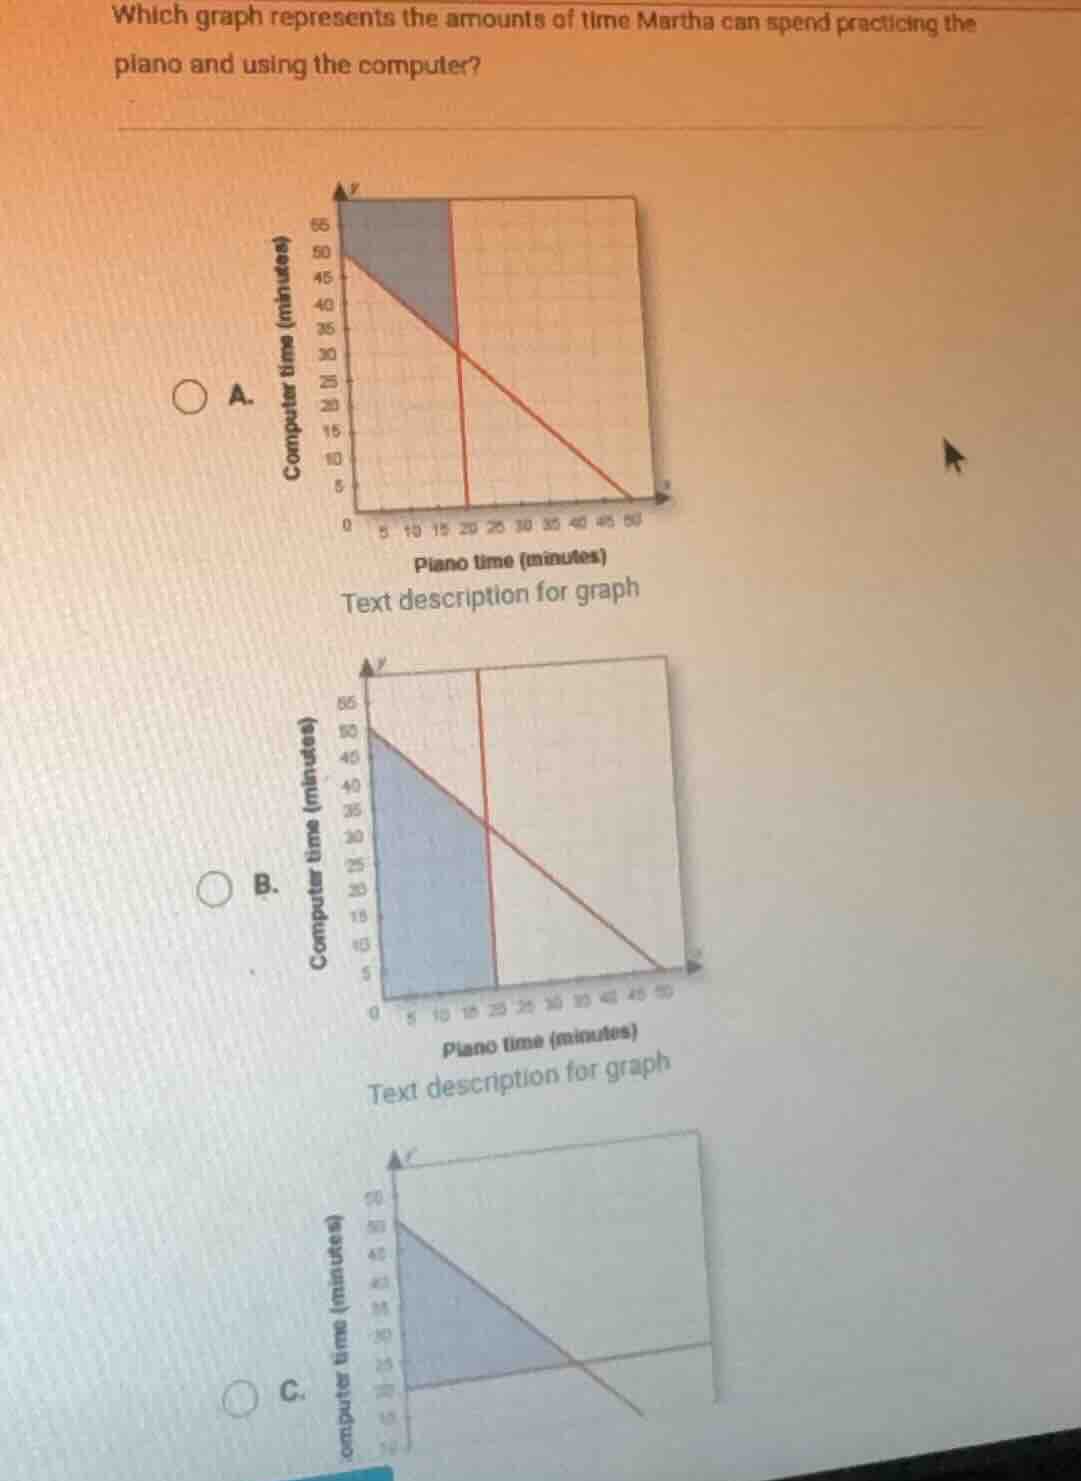
which graph represents the amounts of time martha can spend practicing the piano and using the computer? a. graph a with text description b. graph b with text description c. graph c with partial text
To solve this, we analyze the context of time allocation (piano and computer time) and the feasible region in linear inequality graphs. Typically, such problems involve a constraint like \( x + y \leq \text{total time} \), where \( x \) is piano time and \( y \) is computer time. The feasible region (valid time combinations) lies below the line \( x + y = \text{total} \) and within non - negative time (since time can't be negative).
Step 1: Analyze the Line and Feasible Region
The line in the graphs likely represents the equation \( x + y = 50 \) (assuming total available time is 50 minutes, as the axes go up to 50). The feasible region for time spent (since both times are non - negative and their sum can't exceed the total) should be where \( x\geq0 \), \( y\geq0 \), and \( x + y\leq50 \). This region is below the line \( x + y = 50 \) and in the first quadrant (where \( x\) and \( y\) are non - negative).
Step 2: Evaluate Each Graph
- Graph A: The shaded region is above the line, which would represent \( x + y\geq50 \), but we need \( x + y\leq50 \) (since Martha can't spend more than the total time on both activities). So, A is incorrect.
- Graph B: The shaded region is below the line \( x + y = 50 \) and within the non - negative axes (piano time \( x\geq0 \), computer time \( y\geq0 \)). This matches the feasible region for time allocation (non - negative times whose sum is at most the total available time).
- Graph C: The graph seems to have an incorrect axis or region definition (the axis labels and the region don't align with the standard first - quadrant time - allocation context as well as Graph B).

Snap & solve any problem in the app
Get step-by-step solutions on Sovi AI
Photo-based solutions with guided steps
Explore more problems and detailed explanations
B (the graph labeled B with the blue - shaded region below the line \( x + y = 50 \) and in the first quadrant)