QUESTION IMAGE
Question
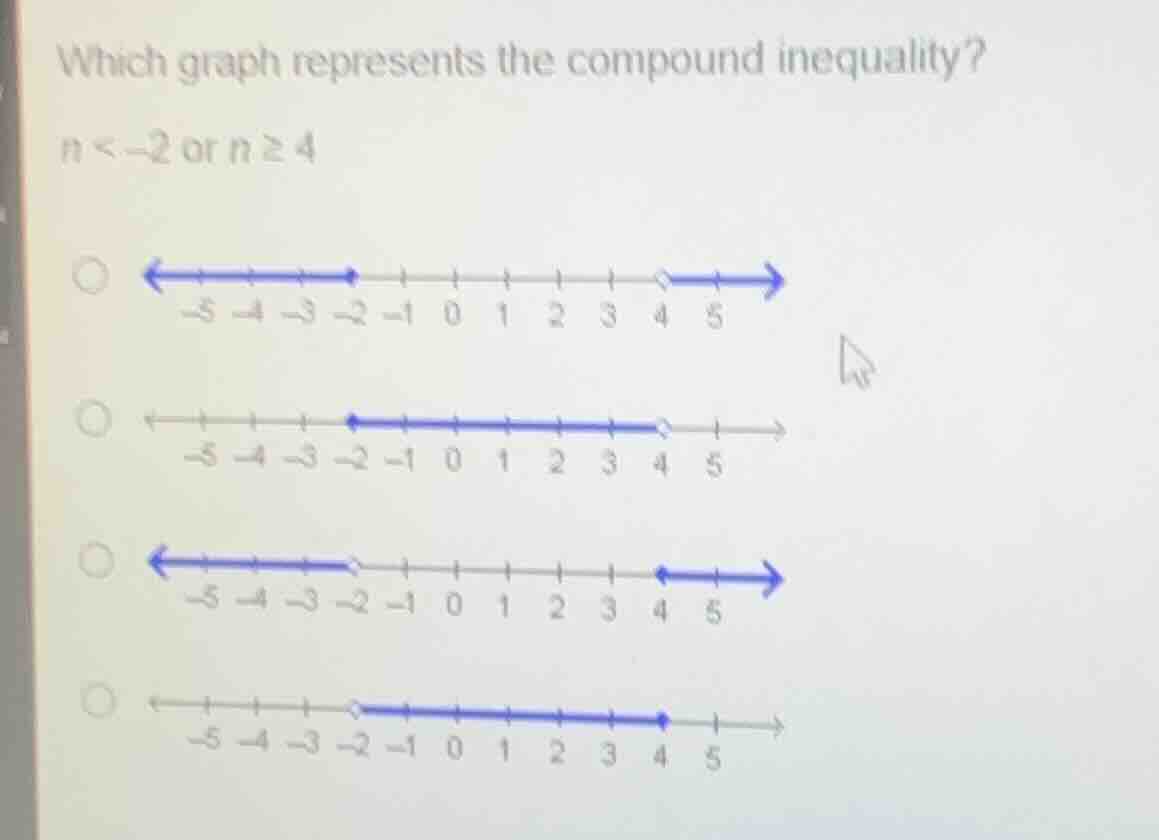
which graph represents the compound inequality?
n < -2 or n ≥ 4
Step1: Analyze $n < -2$
On a number line, this is an open circle at $-2$ (since $n$ cannot equal $-2$) with an arrow pointing left (all values less than $-2$).
Step2: Analyze $n \geq 4$
On a number line, this is a closed circle at $4$ (since $n$ can equal $4$) with an arrow pointing right (all values greater than or equal to $4$).
Step3: Match to the graph
Find the option that combines these two features: open circle at $-2$ (left arrow) and closed circle at $4$ (right arrow).

Snap & solve any problem in the app
Get step-by-step solutions on Sovi AI
Photo-based solutions with guided steps
Explore more problems and detailed explanations
The first option (topmost graph: open circle at $4$, closed circle at $-2$, arrows pointing left from $-2$ and right from $4$)