QUESTION IMAGE
Question
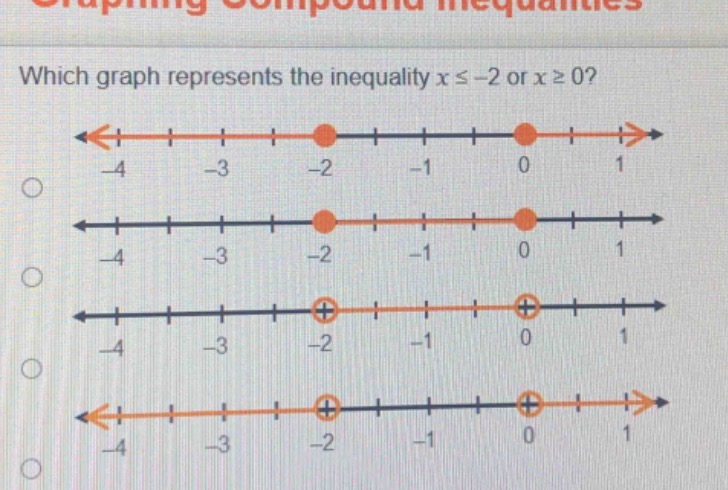
which graph represents the inequality ( x leq -2 ) or ( x geq 0 )?
Step1: Analyze \( x \leq -2 \)
For \( x \leq -2 \), the graph should have a closed dot at \( -2 \) (since the inequality includes equality) and an arrow pointing to the left (for values less than or equal to \( -2 \)).
Step2: Analyze \( x \geq 0 \)
For \( x \geq 0 \), the graph should have a closed dot at \( 0 \) (since the inequality includes equality) and an arrow pointing to the right (for values greater than or equal to \( 0 \)).
Step3: Match with the options
- The first option has a closed dot at \( -2 \) (arrow left) and a closed dot at \( 0 \) (arrow right), which matches our analysis.
- The second option has a line between \( -2 \) and \( 0 \), which is incorrect (we need two separate regions).
- The third and fourth options have open dots, which are incorrect (since our inequalities include equality, we need closed dots).

Snap & solve any problem in the app
Get step-by-step solutions on Sovi AI
Photo-based solutions with guided steps
Explore more problems and detailed explanations
The first graph (with closed dots at -2 and 0, arrow left from -2 and arrow right from 0)