QUESTION IMAGE
Question
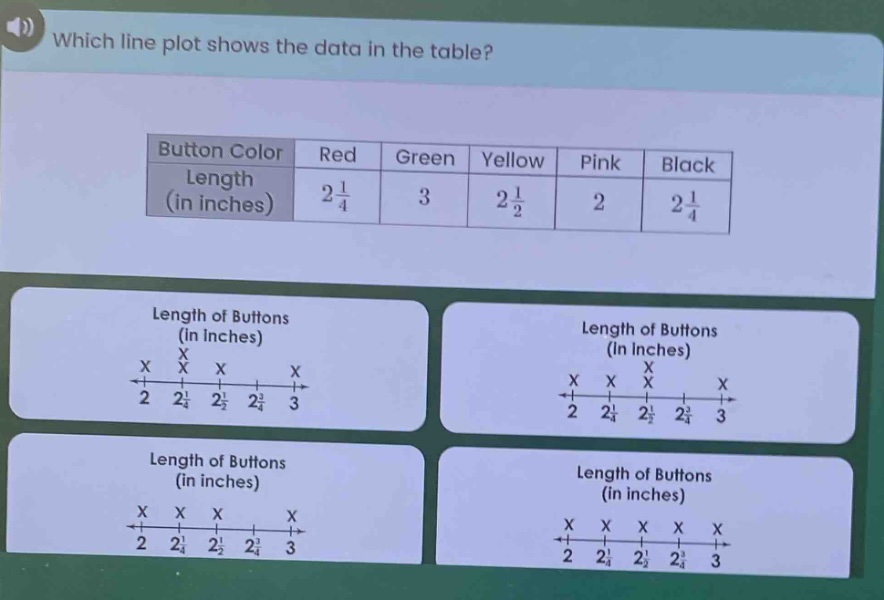
which line plot shows the data in the table?
button color | red | green | yellow | pink | black
length (in inches) | $2\frac{1}{4}$ | 3 | $2\frac{1}{2}$ | 2 | $2\frac{1}{4}$
four line plot options are shown, each labeled length of buttons (in inches) with a number line from 2 to 3 and x marks at different positions:
- first plot: x at 2, two xs at $2\frac{1}{4}$, x at $2\frac{1}{2}$, x at 3
- second plot: x at 2, x at $2\frac{1}{4}$, two xs at $2\frac{1}{2}$, x at 3
- third plot: x at 2, two xs at $2\frac{1}{4}$, x at $2\frac{1}{2}$, x at 3
- fourth plot: x at 2, x at $2\frac{1}{4}$, x at $2\frac{1}{2}$, x at $2\frac{3}{4}$, x at 3
Step1: Tally data frequencies
- Length 2: 1 (Pink)
- Length $2\frac{1}{4}$: 2 (Red, Black)
- Length $2\frac{1}{2}$: 1 (Yellow)
- Length 3: 1 (Green)
Step2: Match to line plots
Compare tallies to each plot:
- Top-left plot has 1 X at 2, 2 Xs at $2\frac{1}{4}$, 1 X at $2\frac{1}{2}$, 1 X at 3, which matches the data.

Snap & solve any problem in the app
Get step-by-step solutions on Sovi AI
Photo-based solutions with guided steps
Explore more problems and detailed explanations
Top-Left Line Plot: Length of Buttons (In Inches) with:
- 1 X at 2
- 2 Xs at $2\frac{1}{4}$
- 1 X at $2\frac{1}{2}$
- 1 X at 3