QUESTION IMAGE
Question
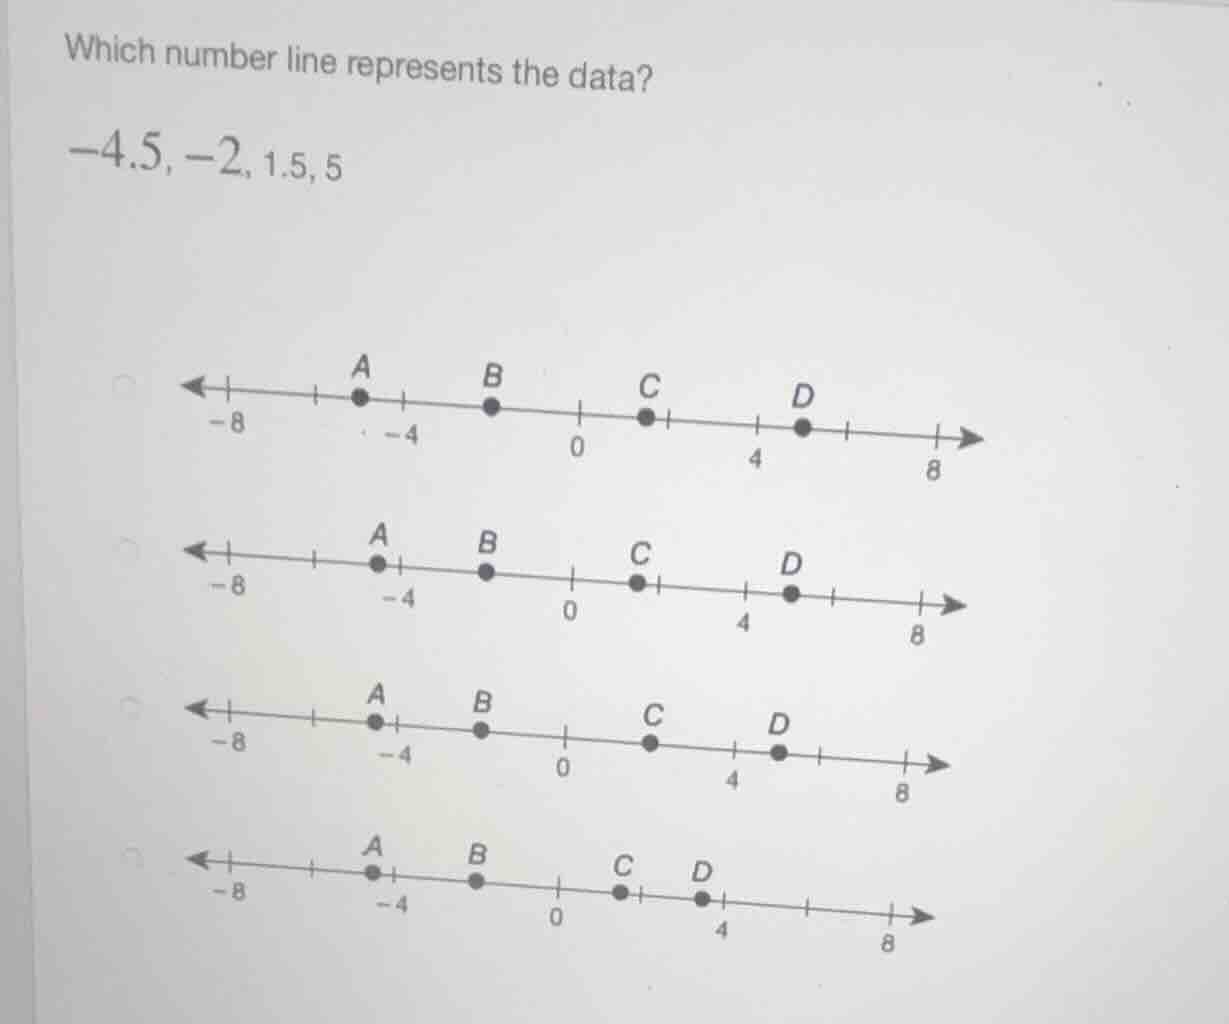
which number line represents the data? -4.5, -2, 1.5, 5 (four number lines with points a, b, c, d are shown)
Step1: Identify interval size
Each tick mark = 1 unit.
Step2: Locate each value
- $-4.5$: halfway between $-5$ and $-4$ (matches point A)
- $-2$: 2 units left of 0 (matches point B)
- $1.5$: halfway between 1 and 2 (matches point C)
- $5$: 5 units right of 0 (matches point D)
Step3: Match to number line
Check which line has A at $-4.5$, B at $-2$, C at $1.5$, D at $5$.

Snap & solve any problem in the app
Get step-by-step solutions on Sovi AI
Photo-based solutions with guided steps
Explore more problems and detailed explanations
The second number line (the one where point D is positioned at 5, between 4 and 8, with point A at -4.5, point B at -2, and point C at 1.5)