QUESTION IMAGE
Question
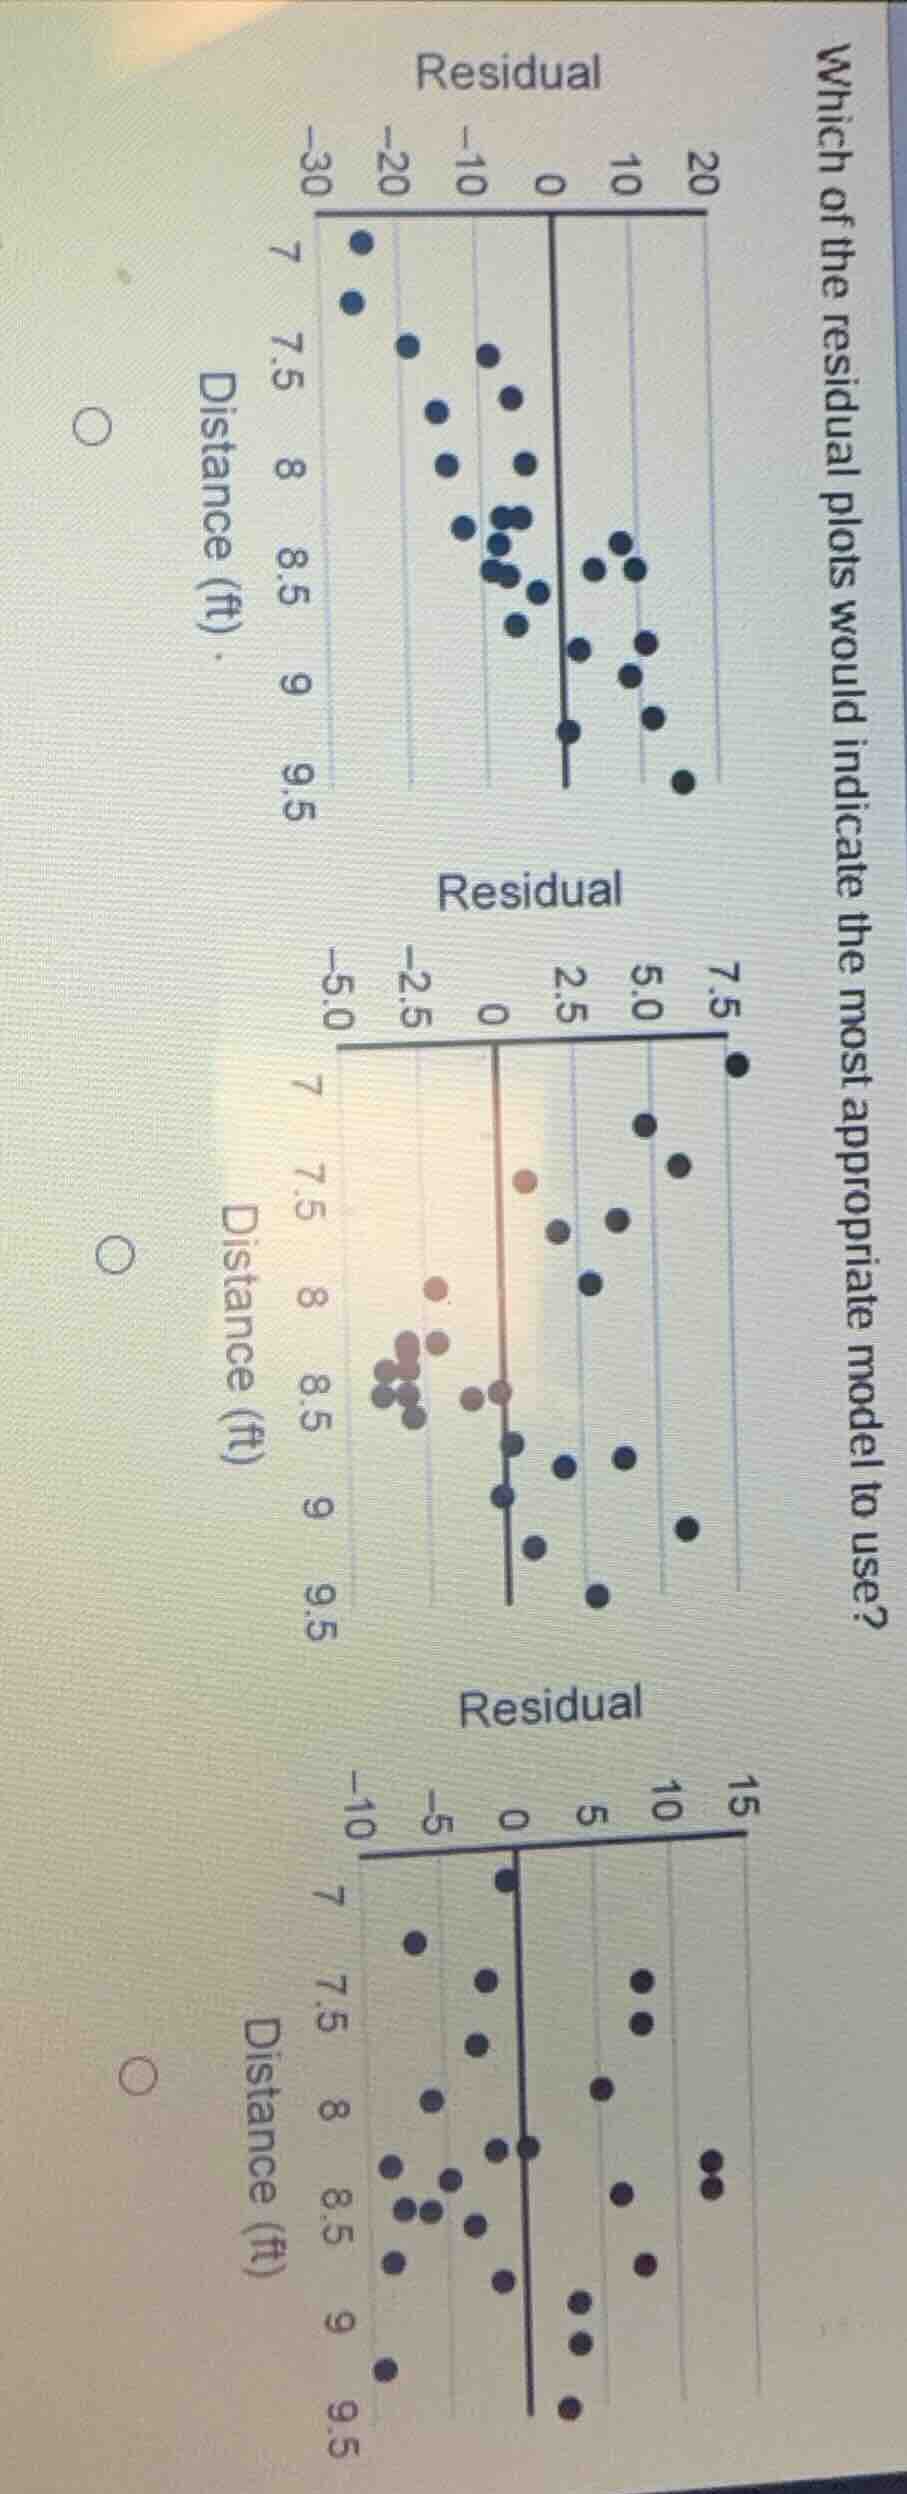
which of the residual plots would indicate the most appropriate model to use?
To determine the most appropriate residual plot for a model, we look for random scatter of residuals around the zero line (no pattern like curvature or increasing/decreasing spread). The second residual plot (middle one) has residuals that appear more randomly scattered with no obvious pattern, indicating the model's residuals are independent and have constant variance, a sign of a good - fitting model. The first and third have patterns (e.g., curvature or spread changes).

Snap & solve any problem in the app
Get step-by-step solutions on Sovi AI
Photo-based solutions with guided steps
Explore more problems and detailed explanations
The middle residual plot (the one with residual axis from - 5.0 to 7.5)