QUESTION IMAGE
Question
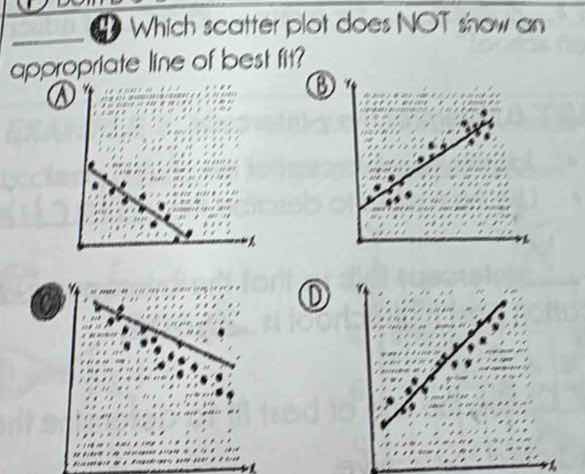
4 which scatter plot does not show an appropriate line of best fit?
a
b
c
d
To determine which scatter plot does not show an appropriate line of best fit, we analyze each option:
Step 1: Understand Line of Best Fit
A line of best fit should represent the general trend of the data points, with most points close to or following the line. It should minimize the distance between the points and the line.
Step 2: Analyze Option A
In plot A, the data points generally follow the downward - sloping line. The points are relatively close to the line and show a consistent negative trend.
Step 3: Analyze Option B
In plot B, the data points follow the upward - sloping line. Most of the points are near the line and show a positive trend.
Step 4: Analyze Option C
In plot C, there are several data points that are far away from the line. The line does not seem to represent the general trend of the majority of the points as well as the lines in the other plots. The distribution of points around the line is less consistent compared to A, B, and D.
Step 5: Analyze Option D
In plot D, the data points closely follow the upward - sloping line. The points are very close to the line, indicating a strong positive trend.

Snap & solve any problem in the app
Get step-by-step solutions on Sovi AI
Photo-based solutions with guided steps
Explore more problems and detailed explanations
C (The scatter plot in option C does not show an appropriate line of best fit as many points are far from the line and the line does not represent the general trend of the data well compared to the other plots.)